
A chart showing commodity support resistance: gold, silver, oil and gas+platinum, palladium, copper agricultural futures (May 14, 2026)
A chart showing commodity support resistance: gold, silver, oil and gas+platinum, palladium, copper+agricultural futures, updated on Thursday, May 14, 2026 at 11:25, covering 14 varieties including gold, silver, platinum, palladium, copper+crude oil, natural gas, fuel oil+wheat, corn, and cotton. For more details, please refer to the latest information analysis chart.
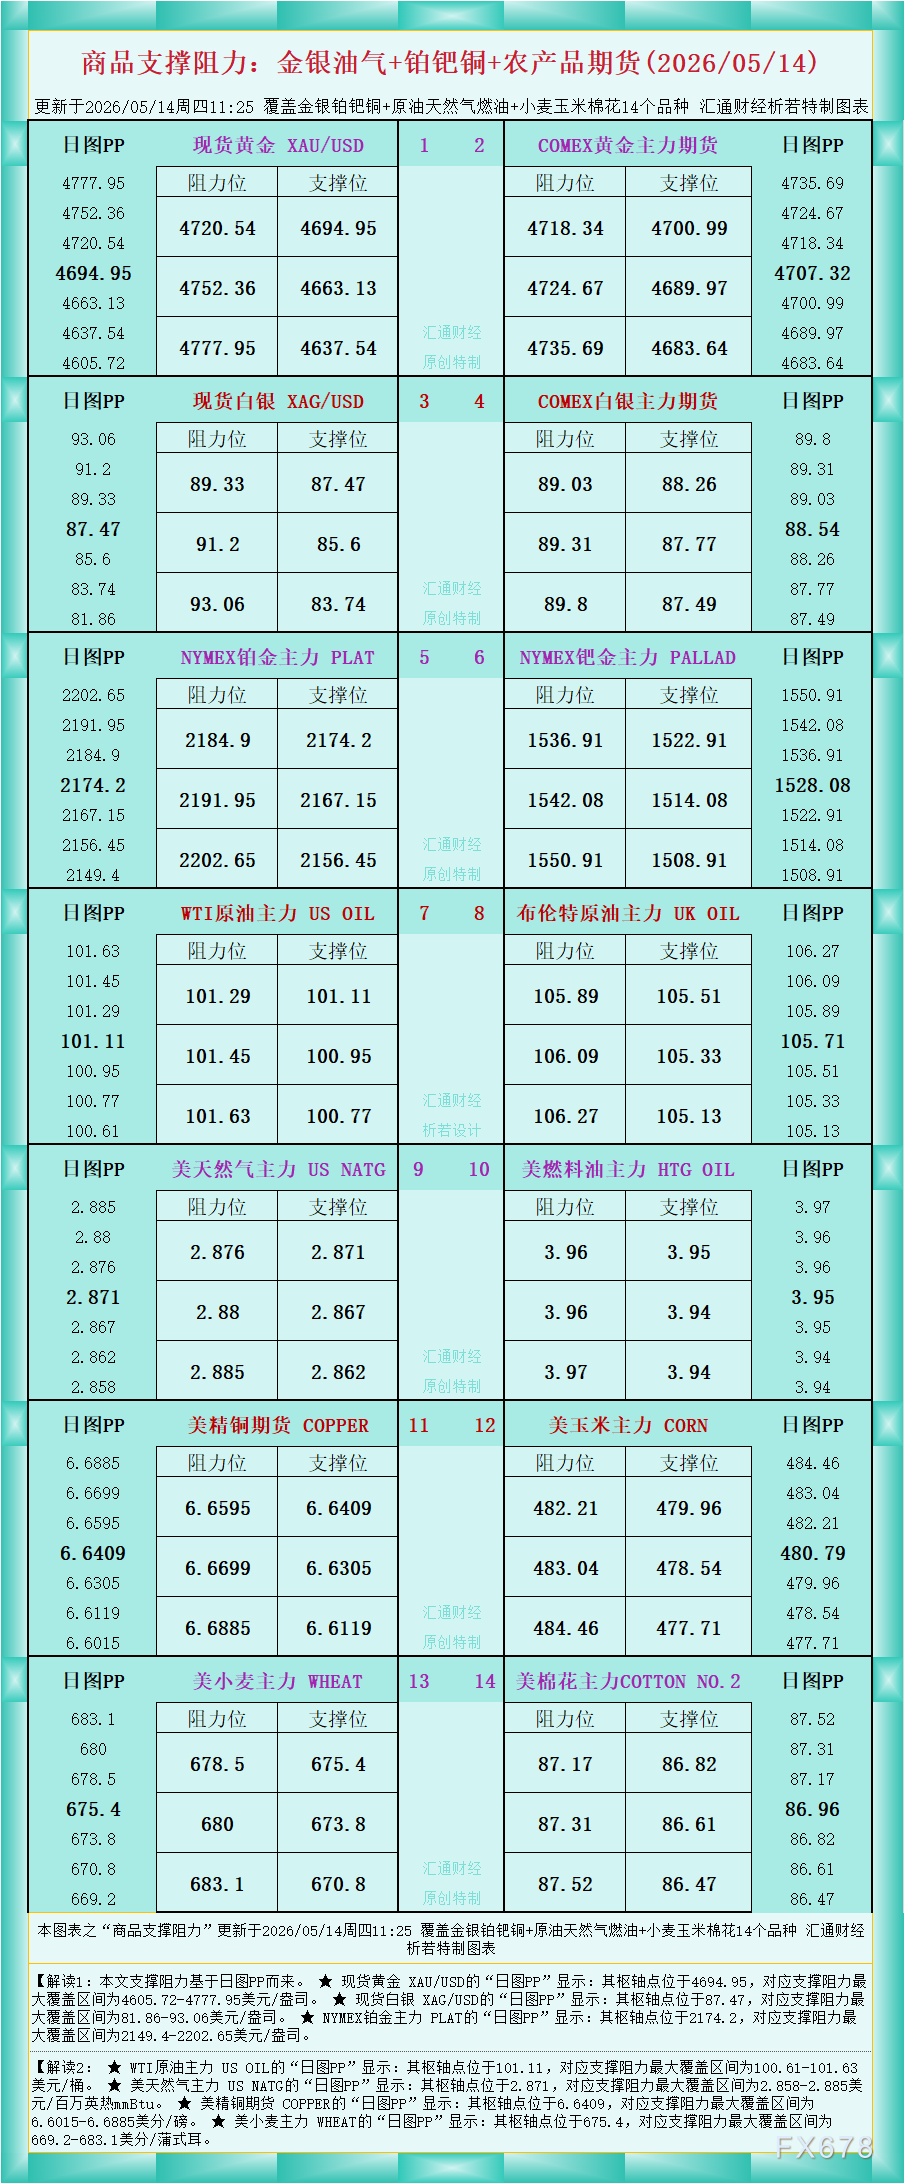
As the data in the figure shows, interpretation 1: This support resistance is based on the daily chart PP.
The "daily chart PP" of spot gold XAU/USD shows that its pivot point is located at 4694.95, corresponding to a maximum coverage range of support resistance of 4605.72-4777.95 US dollars per ounce.
The "daily chart PP" of spot silver XAG/USD shows that its pivot point is located at 87.47, corresponding to a maximum coverage range of support resistance of 81.86-93.06 US dollars per ounce.
The "daily chart PP" of NYMEX platinum main PLAT shows that its pivot point is located at 2174.2, corresponding to a maximum coverage range of support resistance of 2149.4-2202.65 US dollars per ounce.
Interpretation 2:
The "daily chart PP" of WTI crude oil main US OIL shows that its pivot point is located at 101.11, corresponding to a maximum coverage range of support resistance of $100.61-101.63 per barrel.
According to the "Daily PP" chart of US NATG, the main natural gas company in the United States, its pivot point is located at 2.871, corresponding to a maximum coverage range of support resistance of 2.858-2.885 USD/MMBtu.
The daily chart PP of Copper Futures COPPER shows that its pivot point is located at 6.6409, corresponding to a maximum coverage range of support resistance of 6.6015-6.6885 cents/pound.
★ The "daily chart PP" of the main wheat force WHEAT shows that its pivot point is located at 675.4, corresponding to a maximum coverage range of support resistance of 669.2-683.1 cents/bushel.
For more variety interpretations, please refer to the chart. The latest information is original and specially made, all rights reserved, for reference only.
Please indicate the source when reprinting: https://www.daoctech.com/fxnews/5295.html
Disclaimer: The content of this article does not represent the views of the Institute of Foreign Exchange. The content is for reference only and does not constitute investment advice. Investors operate accordingly at their own risk.