
Anzo Forex: List of 18 straight support resistance on August 8th
A chart showing the resistance of straight support: US dollar, European and Japanese currencies, commodity currencies, and emerging currencies. The data was updated on Friday, August 8, 2025 at 13:10. The chart covers 18 straight trading varieties including USD/EUR/JPY/GBP/CHF/AUD/CAD, as well as RMB/HKD/RUB/Rand/Krona. For more detailed information, please refer to the chart below.
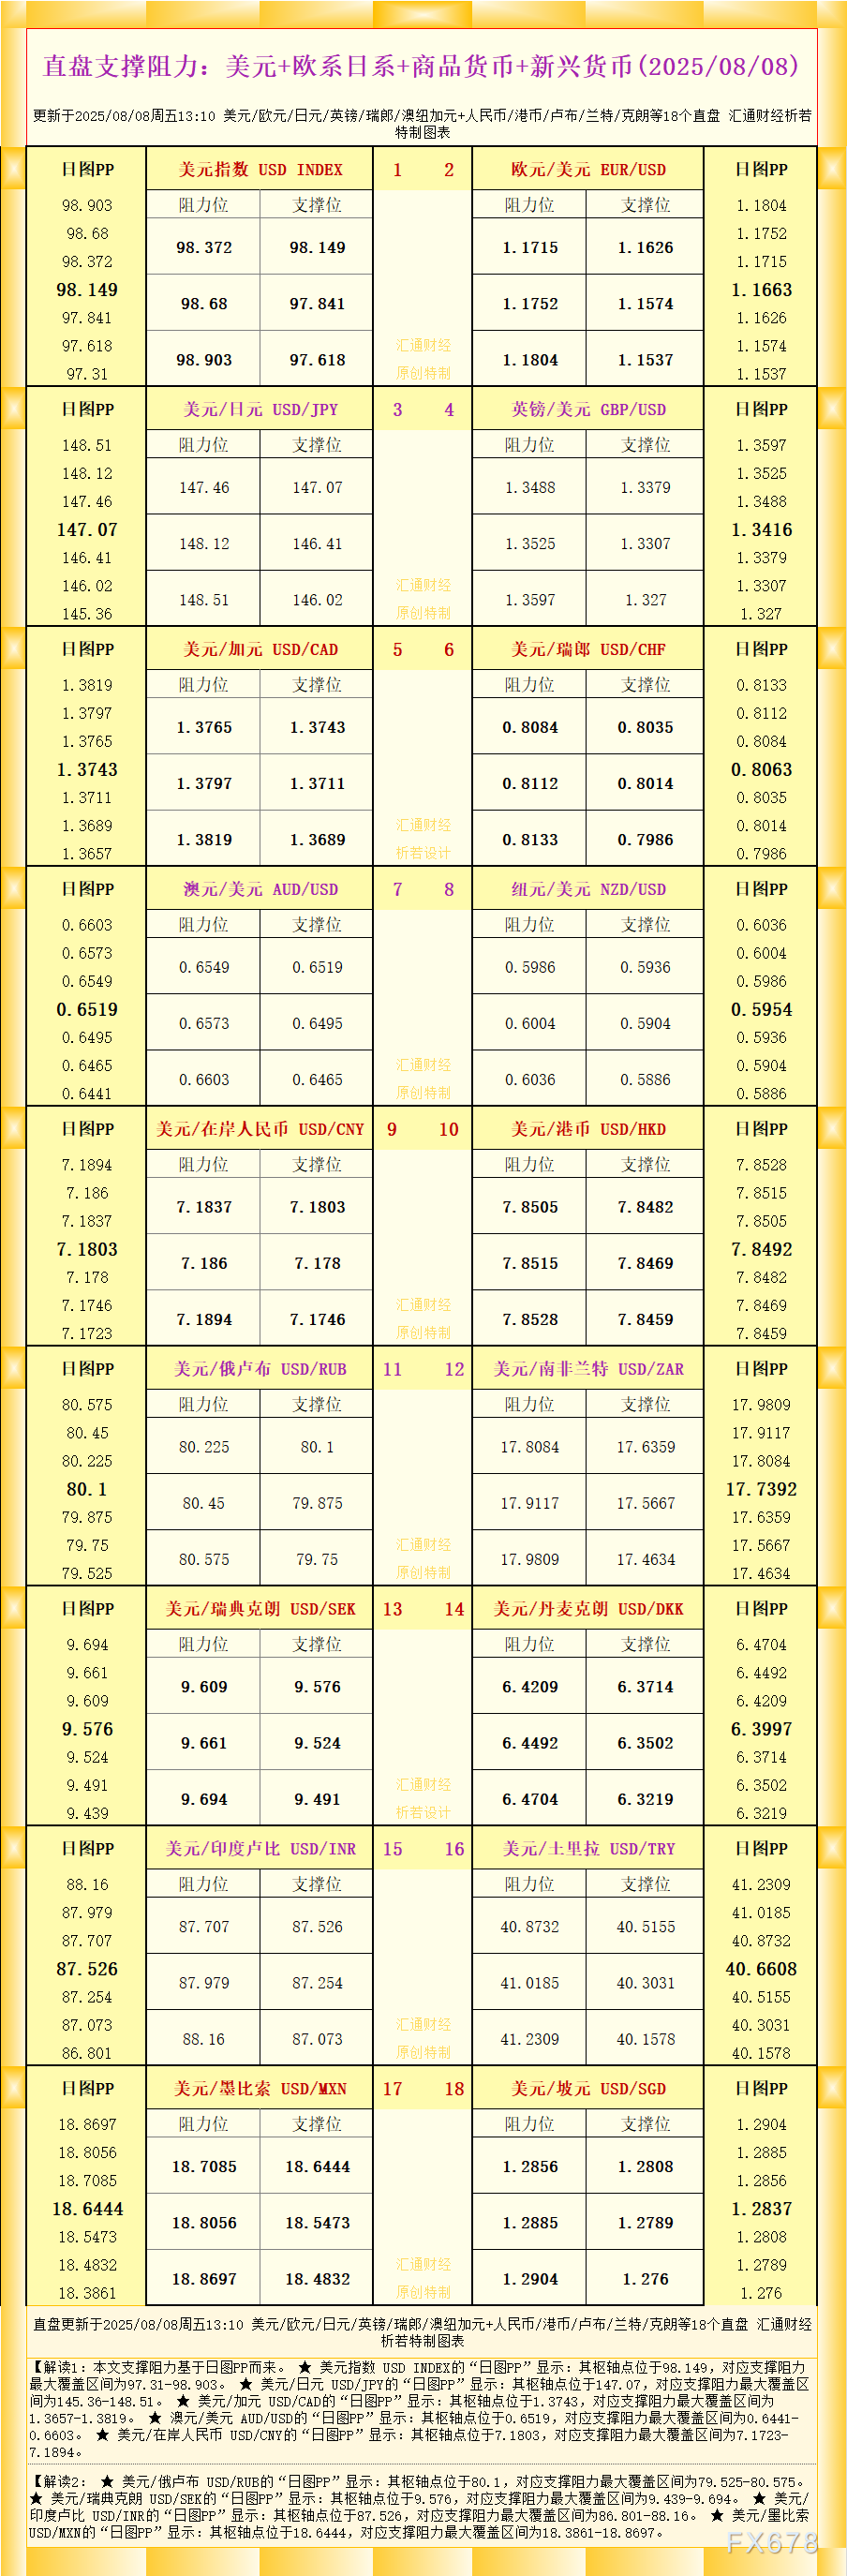
As shown in the data in the figure, interpretation 1: The support resistance listed in this article is calculated based on the daily chart PP.
The "daily chart PP" of the USD INDEX shows that its pivot point is located at 98.149, corresponding to the maximum coverage range of support resistance from 97.31 to 98.903.
The "daily chart PP" of USD/JPY shows that its pivot point is located at 147.07, corresponding to the maximum coverage range of support resistance of 145.36-148.51.
The "daily chart PP" of USD/CAD shows that its pivot point is located at 1.3743, corresponding to the maximum coverage range of support resistance from 1.3657 to 1.3819.
The "daily chart PP" of AUD/USD shows that its pivot point is located at 0.6519, corresponding to the maximum coverage range of support resistance from 0.6441-0.6603.
The "daily chart PP" of USD/onshore RMB USD/CNY shows that its pivot point is located at 7.1803, corresponding to the maximum coverage range of support resistance from 7.1723-7.1894.
Interpretation 2:
The "daily chart PP" of USD/Russian Ruble shows that its pivot point is located at 80.1, corresponding to the maximum coverage range of support resistance from 79.525-80.575.
The "daily chart PP" of USD/SEK shows that its pivot point is located at 9.576, corresponding to the maximum coverage range of support resistance of 9.439-9.694.
The "daily chart PP" of USD/INR shows that its pivot point is located at 87.526, corresponding to the maximum coverage range of support resistance of 86.801-88.16.
The "daily chart PP" of USD/MXN shows that its pivot point is located at 18.6444, corresponding to the maximum coverage range of support resistance from 18.3861-18.8697.
For more variety interpretations, please refer to the chart above. The above content is compiled and presented by Anzo Forex for readers' reference only.
Please indicate the source when reprinting: https://www.daoctech.com/fxoutrade/5260.html
Disclaimer: The content of this article does not represent the views of the Institute of Foreign Exchange. The content is for reference only and does not constitute investment advice. Investors operate accordingly at their own risk.