
Super accurate short-term trading artifact! William Indicators Practical Guide
Williams% R is a momentum oscillator developed by Larry Williams. It is mainly used to measure the overbought or oversold state of the market and help determine the reversal point of the price. It is calculated in a similar way to the Stochastic Oscillator.
The core principle William indicator shows the position of the current closing price relative to the highest and lowest prices of a certain period in the past, ranging from 100 to 0: close to 100: the price is close to the highest price of the period and may be overbought (sell signal). Close to 0: the price is close to the lowest price of the period and may be oversold (buy signal).
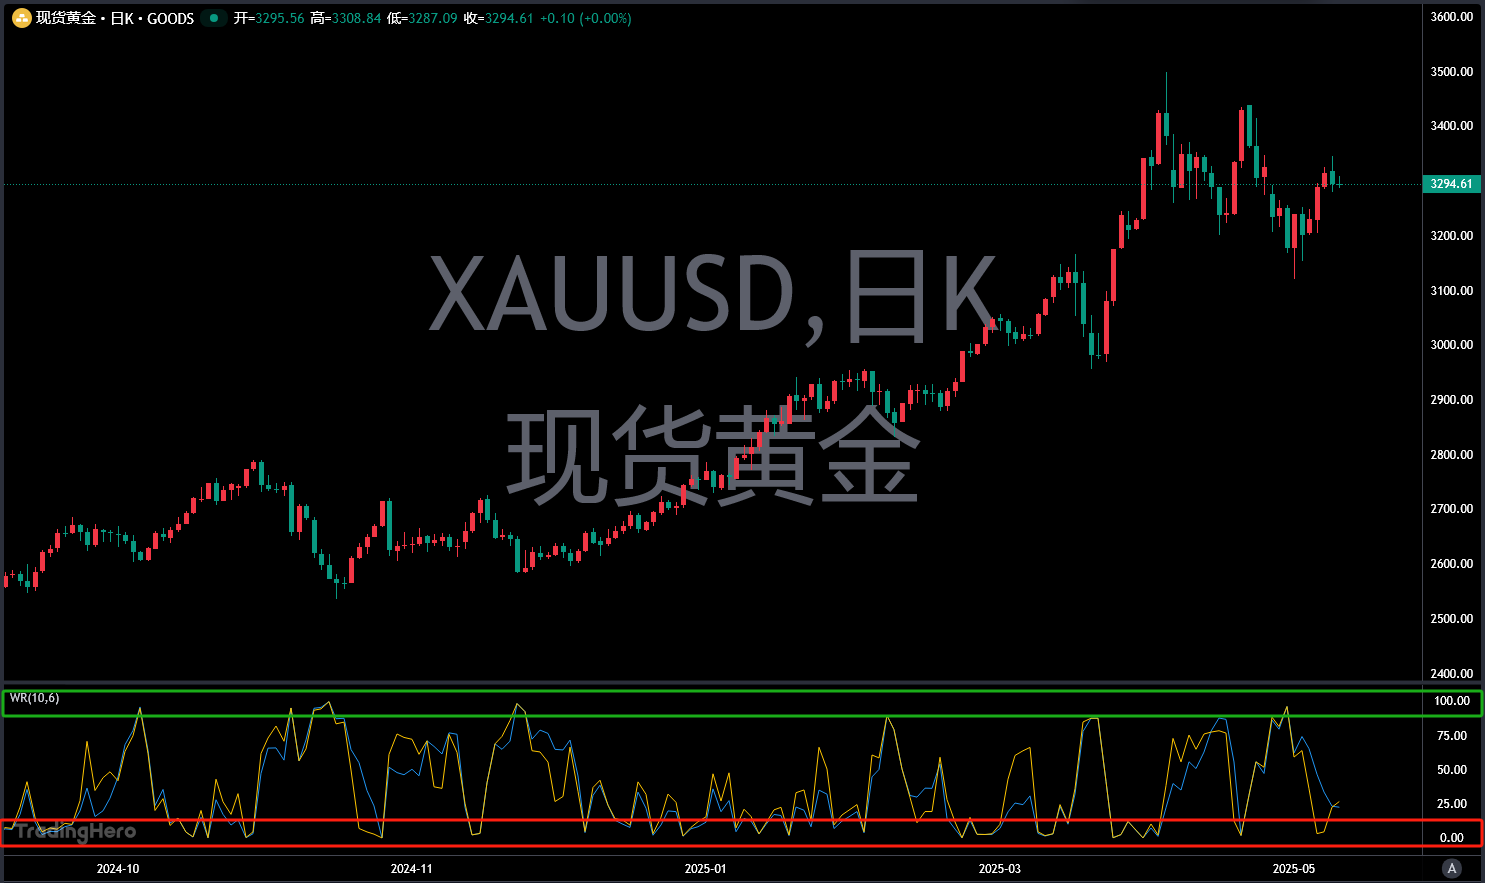
Trading Signals 1. Overbought/Oversold: Overbought zone (80 to 100): Consider selling. Oversold zone (20 to 0): Consider buying. 2. Divergence: Price hits new high, WR does not hit new high: Top diverges, may fall. Price hits new low, WR does not hit new low: Bottom diverges, may rebound. 3. Break through the central axis (50%): 50% of the top: Potential upside momentum. 50% of the bottom: Potential downside momentum.
William indicator advantages and disadvantages
Advantages: Intuitive reflection of extreme market conditions. Suitable for volatile markets (Range-bound Markets). Disadvantages: May signal prematurely in trending markets (need to combine trend indicators such as MACD, moving average filtering). Need to avoid single dependence, better used with volume and support resistance levels.
Practical skills
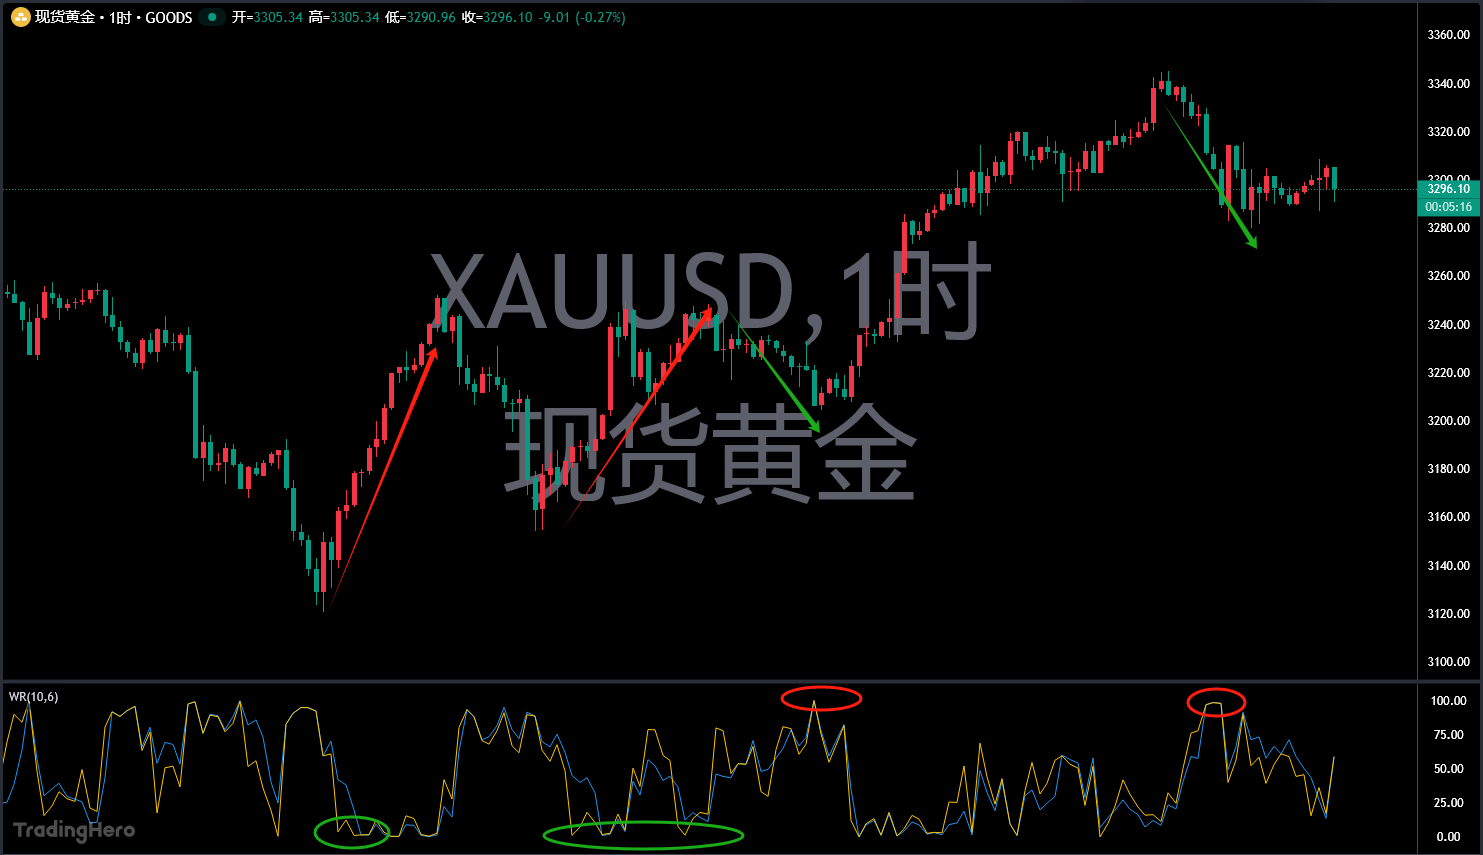
1. Combine Trends: In an uptrend, pay attention to oversold signals (ignore overbought). In a downtrend, pay attention to overbought signals (ignore oversold). 2. Filter False Signals: Wait for WR to return from 80 overbought/oversold before entering the market. 3. Multi-Cycle Verification:
The daily level WR shows a bottom divergence at the 20 oversold + hour line, enhancing the credibility of the signal.
Example chart analysis
Combined with other metrics
RSI: Confirm overbought/oversold (such as WR and RSI oversold at the same time). MACD: Trend direction filtering (WR oversold + MACD gold fork). Bollinger Bands: Price hits Bollinger lower rail + WR oversold. The Wilhelm indicator is simple but effective and is especially suitable for short-term traders. The key is to optimize the parameters through backtesting and use it in combination with other tools to improve the win rate.
Please indicate the source: https://www.daoctech.com/fxschool/1607.html
Disclaimer: The content of this article does not represent the views of the Institute of Foreign Exchange. The content is for reference only and does not constitute investment advice. Investors operate accordingly at their own risk.