
Trading Plan: How to Identify and Trade Reliable Support/Resistance Levels
Let's take an old example. In August 2003, the AUDUSD pullback to 0.6340 hit resistance, and then continued to rise.
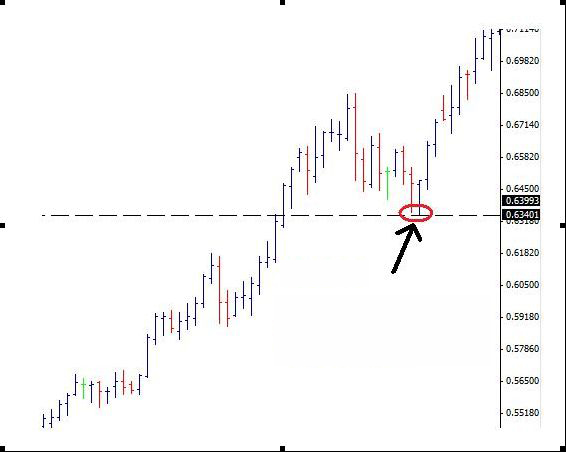
Why is the Aussie resistance at 0.6340? Because this is a long-standing support/resistance level. In 1985, 1997, 1998, 2003, 2009, 0.6340 is a support/resistance level. Aussie, like other currency pairs, has a memory of the main support/resistance levels. In fact, these levels are important prices in the minds of traders. At this price, many institutions will hold on, so the trend will often reverse.
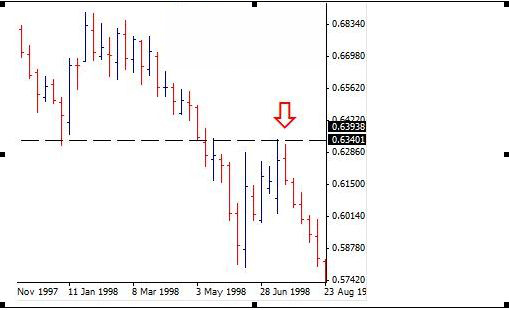
The positions of support and resistance are reversed after being broken, with support becoming resistance and resistance becoming support. In January 1998, 0.6340 was the support level.
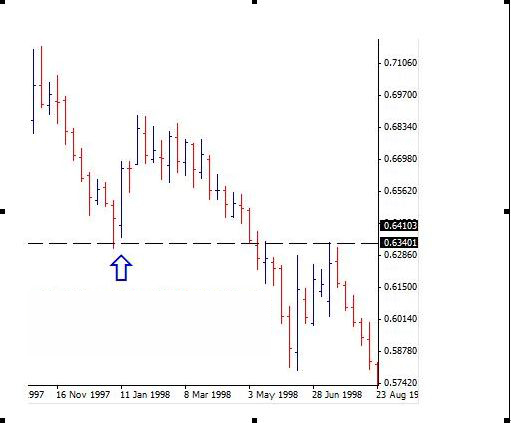
In July of the same year, it became a resistance level again.
Therefore, finding the main support/resistance levels is very helpful for trading. The following rules can be followed for trading with support/resistance levels:
1. Support/resistance is a range, not a line. This range is generally 30-50 points. The higher the period of the chart, the larger the range. The range of the weekly chart is definitely much larger than the 5-minute chart.
2. Near the main support/resistance level, there are other secondary support/resistance levels, and between the secondary support and resistance is the support/resistance area.
3. The price is likely to reverse to this range, but it is best to use other methods to confirm it, such as MACD divergence, candlestick (bullish, bearish), price chart (double top, double bottom), and so on.
4. It is easier to find support/resistance levels with a line drawing.
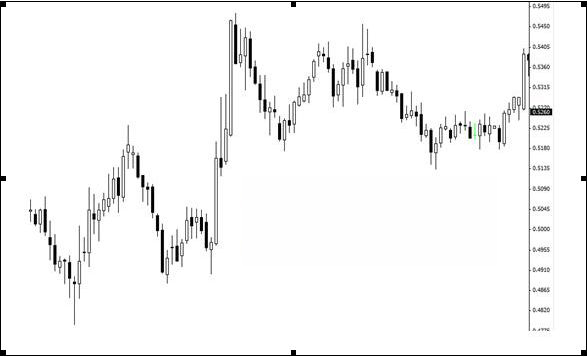
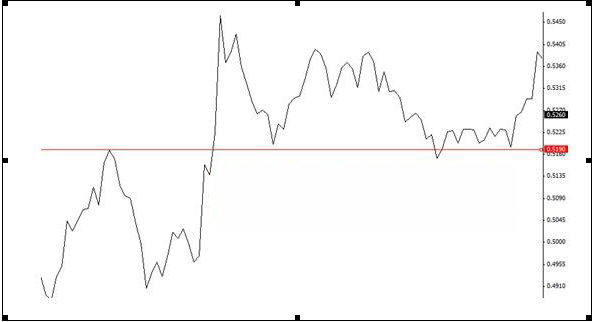
The chart below makes it significantly easier to identify support/resistance levels than the chart above.
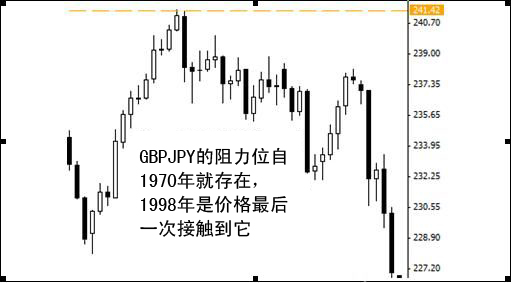
5. Truly strong support/resistance levels will exist for many years, just like old wine, the more you age, the more fragrant you become. You cannot ignore them, especially when these positions are suddenly broken after being touched at the end of many years, most of which will form a strong trend.
6. Forget the first 5 rules and make your own rules. These rules are very useful to me, but you'd better test them with historical data before using them. In fact, any rules, strategies, etc. you read about are best tested first, and it's not really your thing until you are familiar with them.
Please indicate the source: https://www.daoctech.com/fxoutrade/2027.html
Disclaimer: The content of this article does not represent the views of the Institute of Foreign Exchange. The content is for reference only and does not constitute investment advice. Investors operate accordingly at their own risk.