
Analysis of the Core Principles and Market Applications of Dow Theory
Many market analysts use a variety of technical indicators, most of which can be traced back to the "Dow Theory" proposed a century ago.
The theory was founded by Charles Henry Dow (1851-1902), who founded the Dow Jones Company, compiled the Dow Jones Industrial Average, and founded the Wall Street Journal, where he published market commentaries between 1900 and 1902, outlining his insights into price fluctuations.
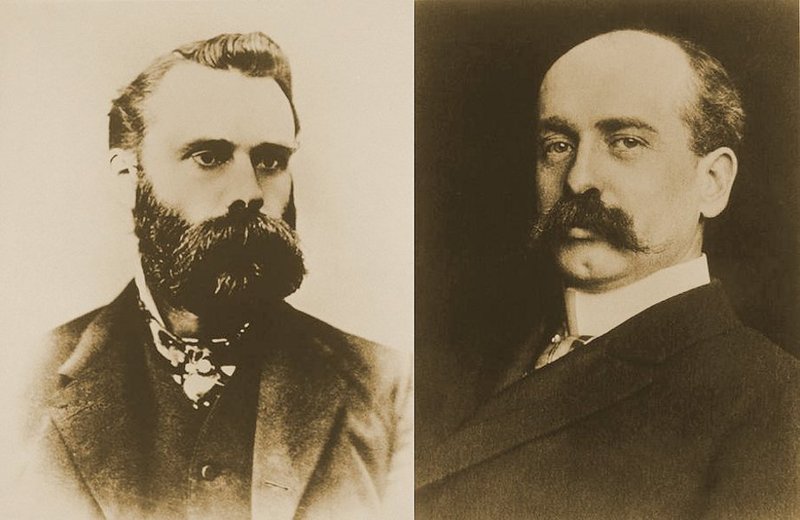
After the death of Charles Dow, the editors of The Wall Street Journal compiled his articles and ideas into a book, "Preliminary Speculation," from which Dow Theory got its name. Although he himself did not systematically expound the theory or publish a monograph, he is still regarded as the originator of the theory. The formation of Dow Theory took decades. After Charles Dow, William Peter Hamilton and Robert Rea inherited and developed the idea, systematized it through subsequent market commentary writing, and formed the theoretical framework we see today. Their "Stock Market Barometer" and "Dow Theory" became the classic documents of later research.
Although there are many emerging market theories that dominate today, Dow Theory was undoubtedly an innovation in its era, and its influence continues to this day.
Dow Theory laid the foundation for many famous systems of technical analysis. For example, the subsequent development of the Elliott Wave Theory was deeply inspired by Dow Theory's idea that "market psychology affects prices".
The following will introduce the fundamentals, assumptions, and applications of Dow Theory to help analysts better understand market fluctuations and make prudent decisions.
The Three Assumptions of Dow Theory
Charles Dow developed the three major assumptions that make up the theory, which are the bedrock of the entire system.
It should be noted that each hypothesis implies that the theory is not absolutely true in all market conditions, and its validity depends on the satisfaction of hypothetical conditions. In reality, these conditions are often difficult to fully realize.
Although the assumptions of Dow Theory may not fit perfectly in reality, they are highly abstract and simplified of the real trading environment and have certain guiding value. They help to build theoretical models, which in turn assist market participants in making judgments.
The three major assumptions of Dow Theory are as follows:
First, market prices evolve in a triple motion. This is the first principle of Dow Theory, which states that price movements are not random, but operate in three simultaneous patterns: primary, secondary, and day-to-day fluctuations, which together constitute a triple motion. Major trends in the market are predictable; minor trends are more difficult to grasp and easy to misjudge; daily fluctuations are random and difficult to predict. Therefore, grasping the main trend is the key to analysis.
This stems from the different time scales of the three movements. Daily fluctuations last days to weeks; minor trends last weeks to months; and major trends can last months or even years. In any market, these three trends always coexist.
Second, prices encompass all market information. This is the second fundamental principle of Dow Theory and one of the most important premises of technical analysis. The theory holds that: "The market reflects everything that all participants know, expect, believe and expect." In theory, at the current price level, buyers and sellers have fully expressed their wishes and the market has reached an equilibrium state, which reflects that all relevant information has been digested. "Information" here refers to all factors that can affect price fluctuations. This assumption implies that market participants have full access to information and that new information is quickly absorbed by the market and reflected in prices.
Third, history repeats itself. This is the third principle of Dow Theory. This assumption allows analysts to use technical analysis methods to predict future movements. This is crucial for technical analysis because its essence is to anticipate the future based on past patterns. "History repeats itself" means that similar price patterns may repeat. The underlying reason is the regularity of the psychological activities of market participants and the stability of human psychological traits. This psychology plays a key role in prices, resulting in repeated patterns of movement in market prices.
Dow Theory and Trend Analysis
The core of Dow Theory is to evaluate and predict the future trend of prices. The theory states that prices move forward in a triple motion, in which the main trend can be identified.
When making decisions, participants first need to confirm the direction of the market trend - whether it is up, down, or in the consolidation stage. When prices reach a peak, there is often a reversal of decline; when prices fall to a trough, there may be a rebound.
The chart below shows the triple movement in the main trend of prices going up or down. When the main trend goes up, it is interspersed with a downside correction, and then goes up again. Conversely, when the main trend goes down, there are multiple bounces and rallies, and then it goes down again. These processes include secondary trends and daily fluctuations.
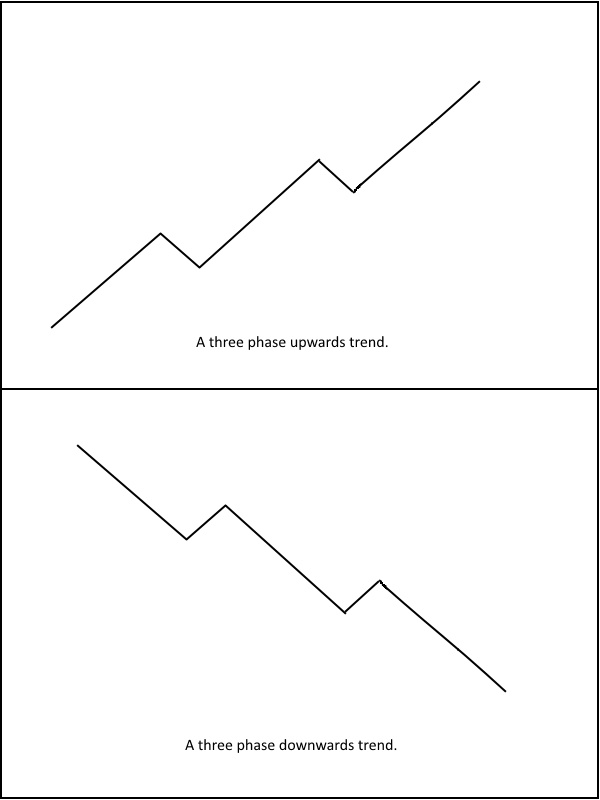
Dow Theory's view of trends is designed to convey to participants: first, to identify the main trend or long-term direction of the market, which often lasts for months or years. Second, to identify secondary or medium-term trends, which often appear as corrections to the main trend, usually lasting weeks to months, and do not completely reverse the main trend. Finally, there are daily fluctuations, which belong to the short-term category. Prices often fluctuate randomly and disorderly in the short term, and the direction is unknown, but usually does not affect the operation of the main trend. Due to the fact that short-term fluctuations often contain a lot of market "noise", it is difficult to accurately reflect the trend, so Dow Theory users usually pay more attention to primary and secondary trends, and tend to use longer time frames such as daily, weekly, or monthly in their analysis.
The triple movement view requires investors to grasp the main trend and avoid being disturbed by short-term fluctuations. In addition, whether the main trend is up or down, the market usually goes through three stages.
In an uptrend, you go through: accumulation phase, public participation phase, top phase. In a downtrend, it corresponds to: distribution phase, public selling phase, panic subsidence phase.
The uptrend begins in the accumulation phase. At this stage, investors with information advantages start to enter the market, they realize that the asset price may be undervalued and is close to the bottom, and it is time to buy. The accumulation phase is at the end of the downtrend, when selling pressure gradually eases and prices stabilize.
Then comes the public participation phase. As the positive factors emerge, the market optimism heats up, and the price starts to reverse and rise; more and more ordinary players join, driving the price up rapidly, and the trend can be established and continue to reach new highs. This phase usually lasts the longest.
As the public flooded in and prices were pushed high, the market gradually became overbought. At this point, investors who entered the market early began to sell their holdings and resell their positions to later participants. The market peaked and the uptrend was nearing its end.
For the uptrend, after the market peaked, many parties began to leave the market and enter the distribution stage, which is also the beginning of the downtrend. Prices no longer hit new highs, and turned to consolidation.
Similarly, when the public realizes that the trend may be turning, the public sell-off stage comes. Continued price declines lead to a loss of confidence, and panic spreads, triggering a concentrated sell-off. Prices fall sharply, and a downward trend is formed.
Finally, as most participants leave the market, the panic gradually subsides, and the price decline moderates and enters the stage of panic subsiding. This often also heralds the beginning of a new round of accumulation.
Application Practice of Dow Theory
The application of Dow theory to market analysis has a long history, and it is usually the first systematic technical theory that many analysts come into contact with.
For beginners, a deep understanding of Dow Theory can be of great benefit. Its essence lies in exploring the relationship between market psychology and price behavior, revealing participant behavior through psychological activities, and then reflecting changes in market supply and demand.
Although Dow Theory originated from the study of the stock market, its basic principles are universal. Short-term fluctuations are often more challenging for participants, and focusing on long-term trends is one way of thinking. Dow Theory's analysis of trends provides a useful perspective for participants who are concerned about the long-term direction.
In addition, it is worth noting that Charles Dow himself has said that his theory is not used to accurately predict the market, nor is it a direct investment guide, but more like a "barometer" reflecting the overall trend of the market. Robert Rea, the successor to the theory, also stressed in his book that Dow Theory is designed to improve the cognitive and knowledge reserves of participants, and is an analytical tool, not an all-round technical system that can be divorced from economic fundamentals and market realities.
Please indicate the source: https://www.daoctech.com/fxnews/2210.html
Disclaimer: The content of this article does not represent the views of the Institute of Foreign Exchange. The content is for reference only and does not constitute investment advice. Investors operate accordingly at their own risk.