
The gold market is volatile at a high level, and the risk of a pullback needs attention
At present, the international gold price is close to the historical high area, its rebound momentum is gradually slowing down, and the market volume is also showing a trend of continuous reduction. According to the position report released by the US Commodity Futures Trading Commission, before the release of key economic data, the market has seen a large-scale long position squaring behavior, which indicates that the adjustment pressure faced by gold prices in the high area is increasing.

Looking at the recent market performance, the rebound of gold prices from a certain support level is generally strong, and the cumulative increase is considerable. However, when the price runs near the historical high, the pace of its rise slows down significantly, and the competition between the long and short sides intensifies. This phenomenon also reminds investors that the current stage needs to be cautious and should not blindly chase higher.
Looking back at the market last week, there were previous views that the rebound in gold prices is expected to continue after gaining support. Combined with this week's price performance, the driving force of the bulls has weakened significantly, and the market is gradually facing the pressure of correction. At this time, it is more necessary to pay attention to the potential downward adjustment risk.
It is particularly important to note that the upcoming US inflation data, as a key indicator of inflation level, will have a direct impact on the trend of gold prices. From the analysis of market consensus expectations, if the released data is slightly higher than expected, it may trigger market speculation about monetary policy tightening, which will put pressure on assets such as gold and may lead to a phased decline in prices.
technical analysis
From a technical perspective, gold futures prices have rebounded significantly since the lows of the beginning of the year. But as prices continue to climb, market volatility has shown a clear downward trend. This deviation usually means that the momentum driving prices higher is weakening and the enthusiasm for market participation has cooled.
More importantly, the volume of gold futures has been in a state of continuous contraction during this round of rebound, forming a divergence between price and volume. This signal often indicates that the current rise lacks sufficient financial support, and the possibility of subsequent corrections is increasing.
However, it needs to be clear that for the price of gold to carry out a deep correction, a key condition needs to be met: that is, to effectively break through the low support formed at the beginning of the year and confirm the continuation of the downward trend from the historical high. If this happens, it means that the current rebound may only be a technical backdraw in the process of falling, and the market may still return to the adjustment pattern in the future.
Combined with the chart analysis of gold futures on relevant exchanges, several key signals can be observed: firstly, there is a clear resistance in a certain price range, and the gold price has failed to break through effectively after many attempts, indicating that the selling pressure in this area is heavy; secondly, the key trading volume control points at the weekly level are located in two positions, which may become an important support reference for subsequent price corrections; thirdly, the trading volume and volatility go down simultaneously, further confirming the judgment of long power decay; fourthly, some technical indicators show a weakening trend when the gold price runs below the high level, suggesting that the buying power is fading.
Gold target level analysis for possible pullback: key support levels are of concern
Based on the current market trends, technical signals, and positions, the basic judgment is that in the short term, the price of gold is likely to hold the low point at the beginning of the year, and the possibility of a sharp break down is low, but the market rebound momentum may further weaken, and the price may enter the stage of shock consolidation.
From the perspective of bearish factors, the current market has not yet seen the core negative catalyst that can trigger a new round of sharp decline in gold prices, and there has been no substantive change in either the macroeconomic environment or the policy level. At the same time, the futures position data also shows that the current round of gold price decline is mainly due to the concentration of long investors who held positions in the early stage to stop losses and leave the market, rather than the bears taking the initiative to build large-scale positions. This feature also determines that the current downward momentum is relatively limited.
From the perspective of the specific trend pattern, the gold price formed a specific top pattern near the previous high, and this round of rebound happened to be blocked and fell back near the low point of this pattern, which reflects the widening of the market's long-short divergence and the pressure above. At present, market participants are paying close attention to a key resistance level. If the gold price can effectively break through this position with volume, it is expected to continue the rebound in the future; but from the current situation, this possibility is relatively small.
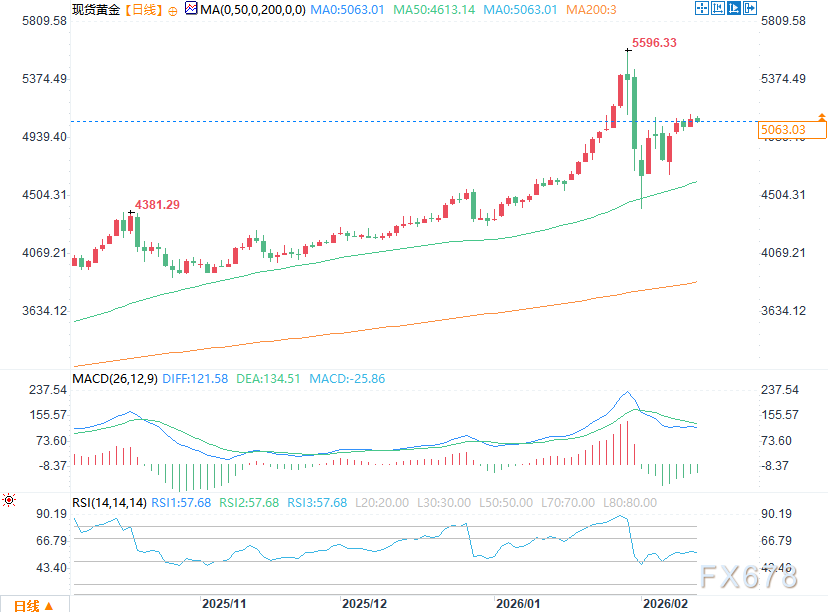
(Daily chart of spot gold, source: Internet)
The follow-up needs to focus on two technical signals: one is whether there will be a bearish reversal pattern at the daily level, and the other is whether the intraday trend will form a band high. Once either of these two signals appears, it may mean that the gold price correction is officially launched, and the downside target will first point to the location of the key volume control point at the weekly level. If the support fails, it may further test the important integer pass below.
At the same time, it should be noted that there are still a considerable number of investors on the sidelines, who may be looking for buying opportunities after waiting for a reasonable correction in the price of gold. This potential "buy on the dip" demand may limit the downside of gold prices to a certain extent, so that it is likely to stabilize above the lows of the beginning of the year and avoid excessive declines.
Analysis of Gold Futures Position
According to the gold futures position report released by relevant institutions, since the peak of net long position at a certain time last year, traders in the futures market have always maintained a cautious attitude towards the rebound in gold prices and have not blindly followed up to do more.
In the process of the gradual rise of gold prices and the impact of key psychological barriers, the market's long positions have indeed rebounded, reflecting that some investors still have expectations for the market outlook. However, with the gradual decline in gold prices and the intensification of market volatility, long investors who held positions in the early stage began to concentrate on position squaring and leave the market, triggering a round of obvious position squaring tide.
The specific data shows that in the past two weeks, the net long position of gold futures has decreased significantly, and the decline is relatively large, reflecting the current trend of long position squaring in the market. At the same time, although the total short position in the market has increased slightly, it is still at a low level as a whole. This data feature clearly shows that the current round of gold price decline is mainly dominated by long position squaring, rather than bears actively and vigorously shorting, which has different market meanings.
This long position squaring-led adjustment pattern may provide some support for gold prices. Even if the current trend suggests that there may be a deeper correction in the future, but because the bears do not take the initiative to make efforts, and there is potential buying power outside the market, the downward space of gold prices may be limited, and it is difficult to have a sustained unilateral decline.
Combined with the weekly level of the price chart and position data can be seen: gold net long position fell sharply in the short term, long concentrated positioning squaring phenomenon is obvious, the current gold price is still fluctuating near the key price, long and short sides into the key game stage.
Please indicate the source: https://www.daoctech.com/fxnews/2226.html
Disclaimer: The content of this article does not represent the views of the Institute of Foreign Exchange. The content is for reference only and does not constitute investment advice. Investors operate accordingly at their own risk.