
Analyze market trends using high and low time periods
Seeking high and low is a common analysis method. Its core is to determine the main trend of the market through high-time period charts, and then find specific trading opportunities in low-time period charts.
Next, we will detail this process step by step.
Step 1: Determine the direction of market price trends
☑ Identifying the overall direction of the market is a fundamental part of formulating a trading strategy.
☑ We can usually identify the trend direction by looking at higher highs on high-time period charts.
Example of AUD/USD daily chart:
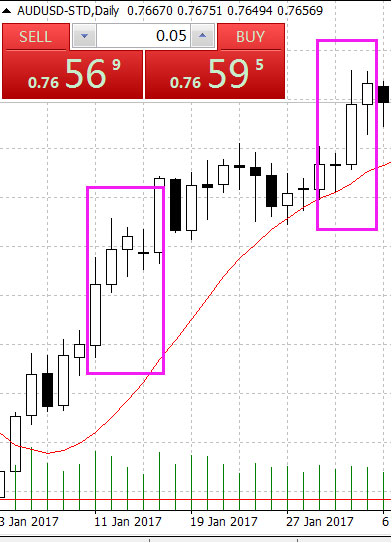
☑ The highs in the chart are usually marked above the K-line, and the points below it are lower lows. In practical analysis, it is necessary to wait for at least two K-lines to close to the right of a high level to confirm the validity of the high level. If this condition is not met, the high level can be temporarily ignored.
A breached high level often indicates the potential direction of the market.
☑ When the K-line price to the right of a high level is higher than the price high below the K-line, the high is considered to have been broken. Similarly, if the K-line price to the right of the low level is lower than the price low above it, the low is considered to have been broken.
It is important to note that the direct breakout of the high or low price of the K-line is an important signal for judging the direction of the trend.
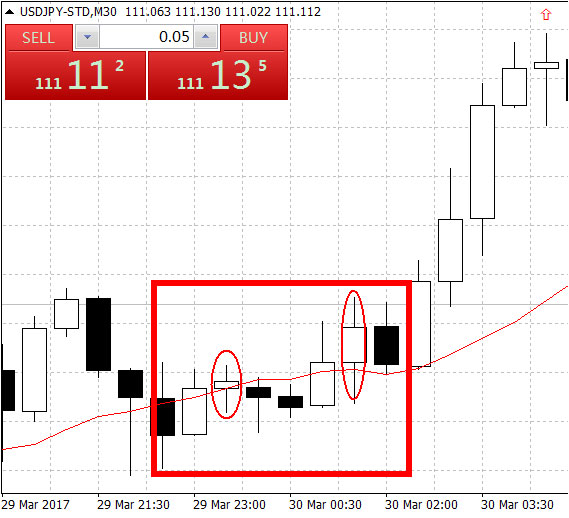
As shown in the figure, the first marked K-line price high was broken by the subsequent marked K-line.
☑ The final direction of the market depends on the type of breakout that was last seen. To accurately judge, we need to find the level of the new high or new low that was last formed.
If the last break forms a new high level, the market tends to rise; conversely, if a new low level is formed, the market tends to fall.
Of course, the breaking point used to determine the trend is not necessarily the high and low point at the very end of the chart. The key is to understand that it is the last "higher high" or "lower low" that determines the direction of the market. Refer to the chart below to understand:
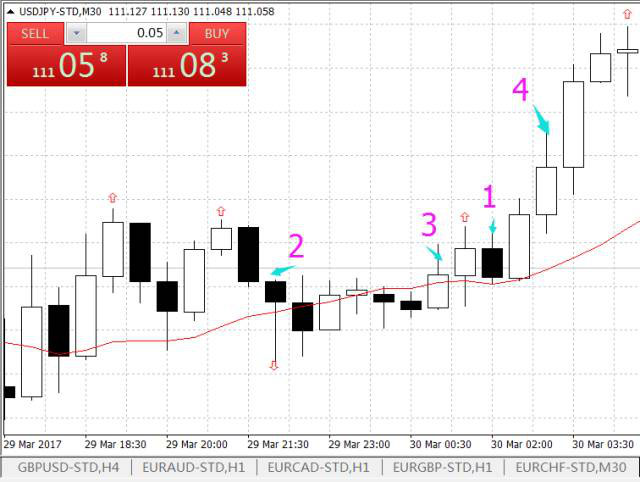
In the chart above, the price breakout shown at position 2 confirms the downward trend, but then there is an upward fluctuation at position 3, mixed with a small adjustment at position 1. Finally, position 4 achieves a decisive breakout, which determines that the market will turn higher.
Trading experience sharing
Technical analysis method
We can also simplify the above analysis process into the following steps:
Identify the last breaking point in the upward trend
Identify the last breaking point in the downtrend
The direction indicated by the recent breakthrough points is the current market trend
Therefore, if the last breakout point is an upside breakout, the market is bullish; vice versaTickmillIn such a trading environment, a clear judgment of trends is a prerequisite for making decisions.
After identifying the overall market trend for a particular trading instrument, investors can start looking for more refined trading opportunities.
Please indicate the source: https://www.daoctech.com/fxnews/2231.html
Disclaimer: The content of this article does not represent the views of the Institute of Foreign Exchange. The content is for reference only and does not constitute investment advice. Investors operate accordingly at their own risk.