
Iran situation signal and US dollar trend analysis
On Wednesday (April 22), the global financial marekt entered a relatively stable stage. After experiencing obvious shocks caused by regional fluctuations in the previous period, the market is trying to find a new price reference point in the uncertainty. With the Federal Reserve officially entering a period of silence ahead of the April 28-29 interest rate meeting and no important economic data released on that day, investors' focus has shifted from monetary policy expectations to the financing rhythm of the Treasury and the marginal changes in the geopolitical situation.
US Treasury yields, the US dollar index and spot gold are currently showing a limited and volatile trend. On the one hand, trade uncertainty caused by tariff rhetoric and artificial intelligence-driven productivity discussions have put long-term inflation expectations in a game state; on the other hand, the ceasefire extension on the international situation has reduced the immediate "tail risk", but has not completely eliminated the premium. This "managed tension" has led to repeated tug-of-war between gold and US Treasuries between their safe-haven properties and the cost of holding.
Treasury Yield: Supply and Demand Game in Narrow Range
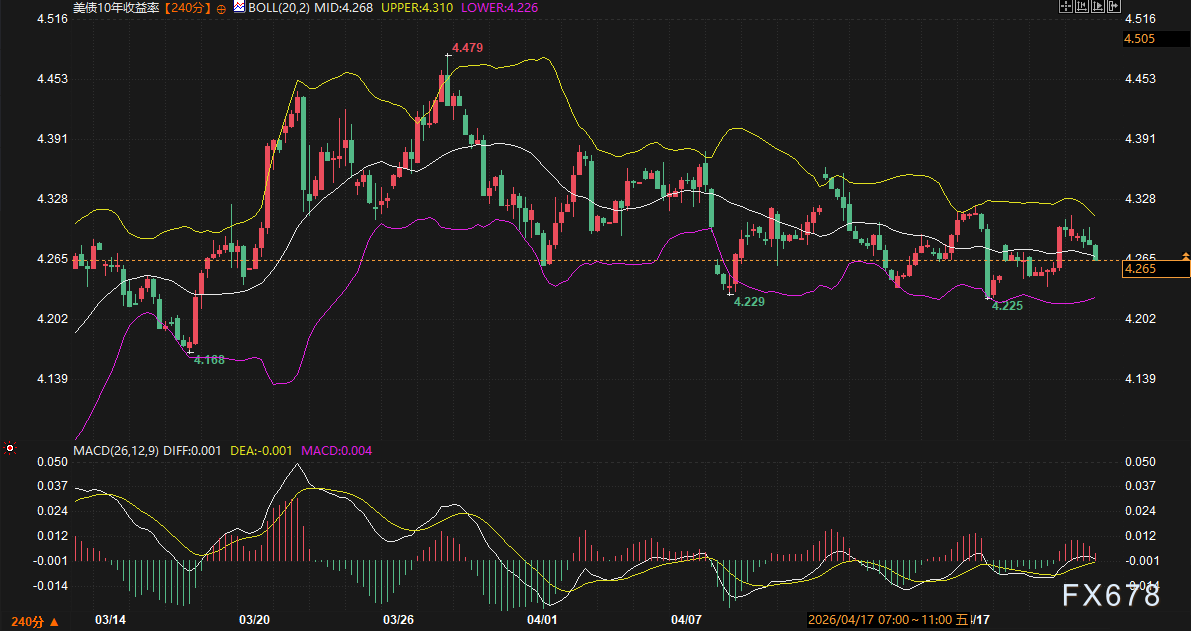
Looking at the 4-hour cycle, the 10-year US Treasury yield is currently closing at around 4.265%. Technically, the Bollinger Band opening shows obvious signs of narrowing, with the mid-rail at 4.268%, which means the market is at the end of volatility convergence. Although the MACD indicator forms a golden fork near the zero axis, the expansion of the red kinetic energy column is extremely limited, reflecting the lack of bulls' driving force.
Fundamentally, the liquidity of today's market is mainly driven by the issuance activities of the Ministry of Finance. On that day, 17-week short-term government bonds of 69 billion US dollars were issued, and 20-year government bonds of 13 billion US dollars were issued. Combined with the analysis of recent well-known institutions, investors' commitment to long-term bonds will directly determine whether the yield can be effectively broken through. Currently,support intervalMainly concentrated at 4.225% to 4.226% (lower Bollinger Band and mid-April low), whileResistance intervalIt is located at 4.310% of the Bollinger Bands.
Given the contradiction between recent Federal Reserve officials' discussions on the potential for artificial intelligence to depress prices and market skepticism, yields lack the fundamental support to break through the previous high of 4.479% in the short term. In the next 2-3 trading days, Treasury yields are more likely to remain in the range of 4.26% to 4.30% sideways, pending further guidance from next week's interest rate meeting.
Dollar index: technical pressure after bottoming out and recovering
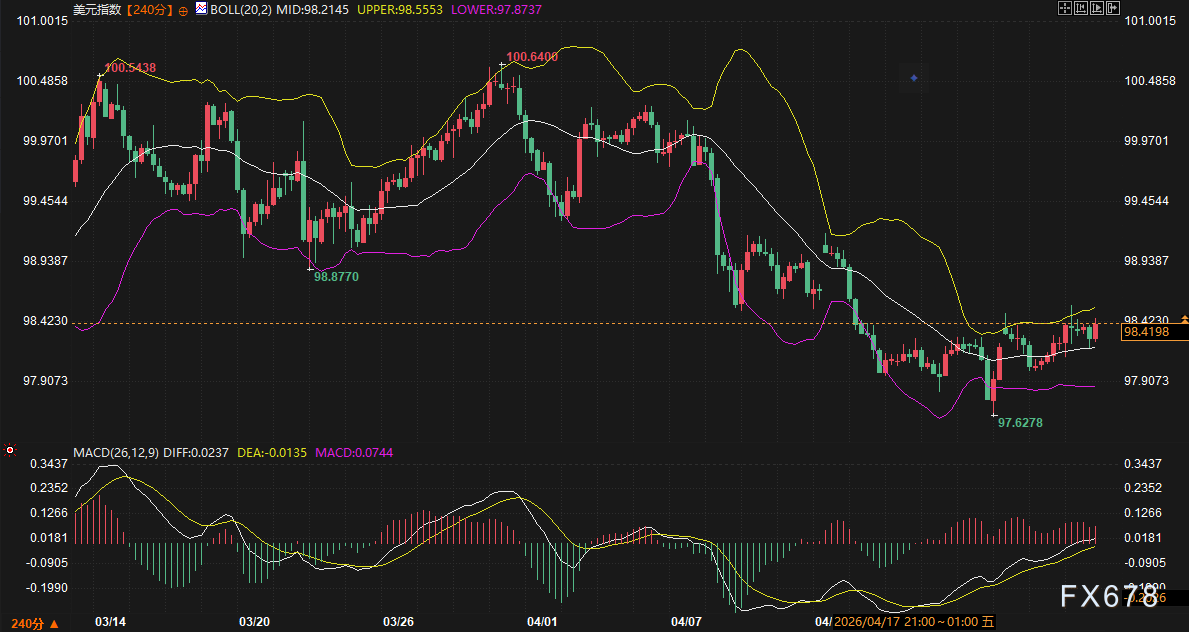
After falling in mid-April, the US dollar index has shown strong resilience and is currently running around 98.42. On the 4-hour chart, the K-line has successfully stabilized the middle Bollinger Band (98.21) and launched an attack to the upper rail of 98.55. The continued expansion of the MACD red kinetic energy column indicates that the short-term technical rebound momentum has not yet exhausted.
However, the further upside of the dollar is hedged by a pullback in geopolitical premiums. Due to the indefinite extension of ceasefire agreements in relevant regions, the sharp fluctuations in crude oil prices, although disturbing inflation expectations, also weakened the absolute attractiveness of the dollar as a single safe-haven asset. In addition, the game on "tariff remarks" has not yet entered the substantive landing stage, and the public exchange market is more in a wait-and-see period.
In the short term, the dollar indexResistance intervalLocked between 98.55 and 98.90. If it cannot break through the upper rail effectively, the market may take profits. Belowsupport intervalLooking back at 98.21 to 97.87. It is expected that the dollar will maintain its volatile and strong pattern in the next two days, but the slope will slow down.
Spot gold: the ebb of risk aversion and the tug of war on the cost side
The current movement of spot gold is closely related to the "ontological uncertainty" of geopolitics. Although the ceasefire agreement removes the trigger point for immediate conflict, the persistence of the maritime blockade still provides bottom support for gold prices.
From the perspective of related assets, the bottoming of the US dollar has put some pricing pressure on gold, while the sideways trading of US bond yields has slowed down the increase in gold's holding costs. The hedging of this force has caused gold prices to fall into a typical shock box recently. Technically, gold prices are facing significant selling pressure near the previous high, especially in the context of market sentiment turning to "sell on the high".
In the next 2-3 days, the trend of gold will be highly dependent on whether new friction points are ignited in the geopolitical situation. In the absence of data stimulus, the price of goldsupport intervalWith reference to previous lows and technical support, andResistance intervalIt is constrained by the strong rebound of the US dollar. Overall, gold lacks a unilateral rally catalyst in the short term, preferring to build momentum before making directional choices within the range.
Future Outlook
Comprehensive analysis shows that in the next 2-3 trading days, the global market will be in a phase of "data vacuum period" and "sentiment repair period" intertwined. Due to the lack of new variables in monetary policy, the yield of US bonds will remain in a narrow range of 4.22% to 4.31%. The US dollar index benefits from technical repairs and has the potential to hit resistance above 98.55, but it needs to be vigilant against the reverse correction caused by the easing of geopolitical conditions.
For spot gold, the pressure to take profits after the short-term gains are exhausted cannot be ignored. Ahead of the Fed meeting, participants in the public exchange market generally preferred to hold cash or engage in range arbitrage rather than establish large unilateral positions. Investors should keep a close eye on minor developments in geopolitics and auction multiples for Treasuries, which will be key factors in breaking the current sideways impasse.
[Frequently Asked Questions]
1. Why did the geopolitical situation ease, and gold and oil prices did not experience a sharp decline?
While the current ceasefire removes the immediate threat of war, it is, as prominent institutions have pointed out, a shift from "binary tension" to "chronic management tension". The blockade remains in place, and the potential risk of retaliation has not been eradicated. This continued uncertainty provides a "risk premium floor" for commodities, making prices more resilient when they fall back.
2. What specific impact did the Federal Reserve's silence period have on the market in these days?
The silence period means that the market has lost an important source of momentum from official speeches. In the absence of an official "release", the market will return to technical drive and become more sensitive to the existing Treasury bond issuance plan. This means that unless there are unexpected geopolitical events, market volatility in the next two days is usually lower than the non-silence period.
3. How does the discussion of artificial intelligence (AI) affect the logic of US Treasury yields?
This involves long-term inflation expectations. If AI can indeed significantly increase productivity, it can theoretically reduce the cost of production and thus lower inflation. If the market accepts this logic, the long-term top of US Treasury yields will move down. But at present, as some senators say, the market is still skeptical of this "AI dividend". This divergence has caused US Treasury yields to fluctuate at high levels, making it difficult to form a joint breakthrough.
4. Why is the resistance of the USD index around 98.55 so critical?
98.55 is the upper track of the current 4-hour Bollinger Band, and it is also an important technical pass for the previous decline to reverse. Since the MACD indicator has run to a relatively high level, if it is blocked and falls here, it will form a short-term "double top" prototype; on the contrary, if it can stand firm, it means that the medium-term reversal trend of the US dollar is established.
5. What is the significance of today's Treasury bond issuance to ordinary investors?
Treasury bond issuance is a "health checklist" for observing market demand for dollar assets. If the issuance rate is lower than market expectations and the subscription multiple is high, it indicates that safe-haven funds are still hungry for US bonds, which will suppress yields and support the dollar. Otherwise, it may trigger selling pressure. During the data gap, this is the only indicator of actual trading.
Please indicate the source: https://www.daoctech.com/fxnews/2324.html
Disclaimer: The content of this article does not represent the views of the Institute of Foreign Exchange. The content is for reference only and does not constitute investment advice. Investors operate accordingly at their own risk.