
How is the OBV energy tide indicator applied?
The Energy Tide Indicator (OBV) was developed by Joe Granville, an American technical analyst, to reflect the inflow and outflow of market funds by combining trading volume with price changes. It is used to judge trend strength, verify breakouts or identify divergence signals. Its four practical application cases are shared as follows, and its use logic and strategies are analyzed in combination with different market scenarios:
trend confirmation
1. Price ↑ + OBV ↑ → Uptrend healthy (continued inflow of funds).
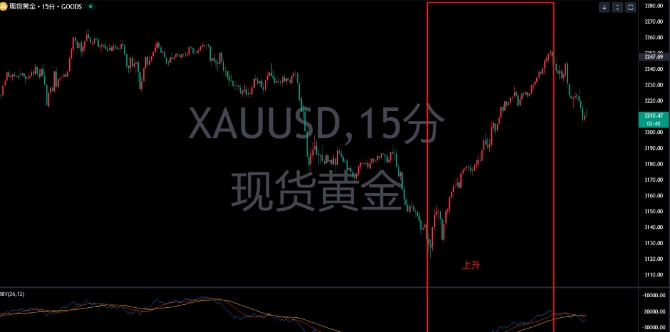
2. Price ↑ + OBV? → Volume and price deviation, possible false breakthrough (be vigilant for callbacks).
3. Price? + OBV? → The downward trend continues (funds continue to flow out).
4. Price? + OBV ↑ → Bottom may be near (funds are coming in quietly).
Breakthrough signal
1. The price breaks through the resistance level + OBV synchronizes the new high → the breakthrough is effective and bullish.
2. The price falls below the support level + OBV synchronized new low → the break is effective, bearish.
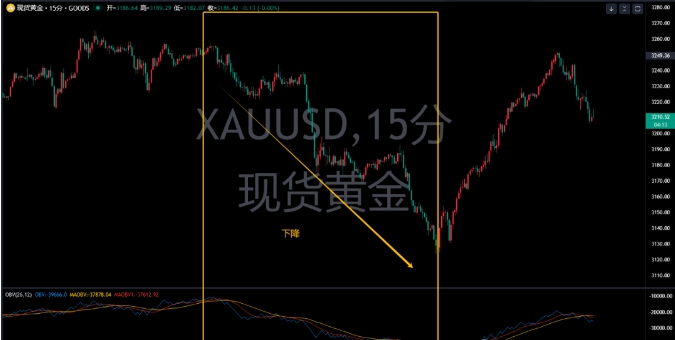
deviation signal
Top divergence: Prices hit a new high, but OBV did not reach a new high → the upward momentum weakened and may reverse.
Bottom divergence: Prices hit a new low, but OBV did not hit a new low → falling momentum exhausted and may rebound.
Combined EMA
The OBV crosses its moving average (e.g. 20-day moving average) → buy signal.
OBV crosses its moving average → sell signal.
summary
The OBV indicator is an important tool to measure market energy. Its core value is to assist in judging stock price trends and capital flows through changes in trading volume. Pay attention when using:
Trend-based, deviation-supplemented: Priority is given to the overall trend of the OBV indicator line, and the deviation signal needs to be verified in combination with other indicators.
Flexible adaptation to individual stocks: The trading volume characteristics of different stocks are different, and the analysis logic needs to be based on stock adjustment.
Combining multi-dimensional analysis: Technical analysis needs to be combined with fundamentals, market sentiment, etc., to avoid one-sided decisions.
Please indicate the source: https://www.daoctech.com/fxoutrade/1603.html
Disclaimer: The content of this article does not represent the views of the Institute of Foreign Exchange. The content is for reference only and does not constitute investment advice. Investors operate accordingly at their own risk.