
Forex chart pattern interpretation and trading application guide
existDLSMIn the field of technical analysis of foreign exchange, the use of chart patterns to determine whether price movements are continuing or reversing is a core skill. First, let's understand the basic characteristics of three common foreign exchange charts. They express the same market meaning, but they are different in terms of intuition and detail.
Candlestick chart: contains four key elements: opening price, closing price, high price, and low price. It is currently the most widely used and most popular type of chart among traders.
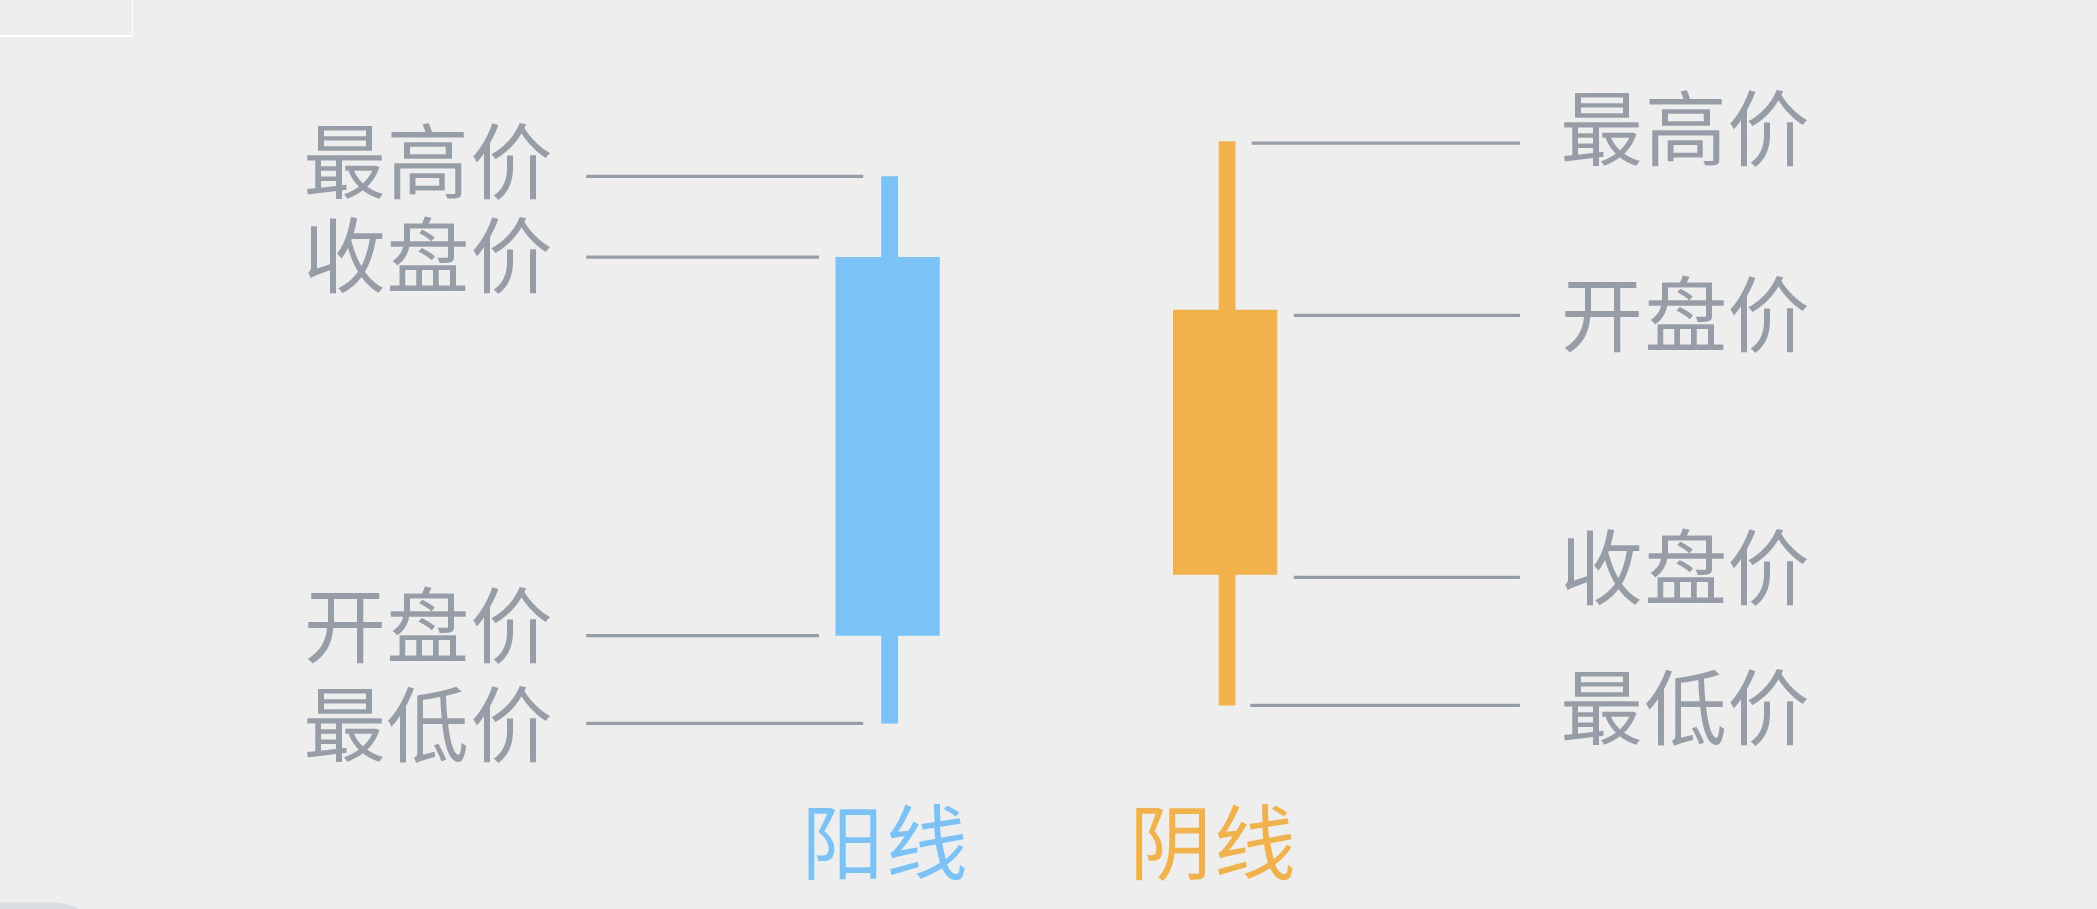
Forex technical analysis
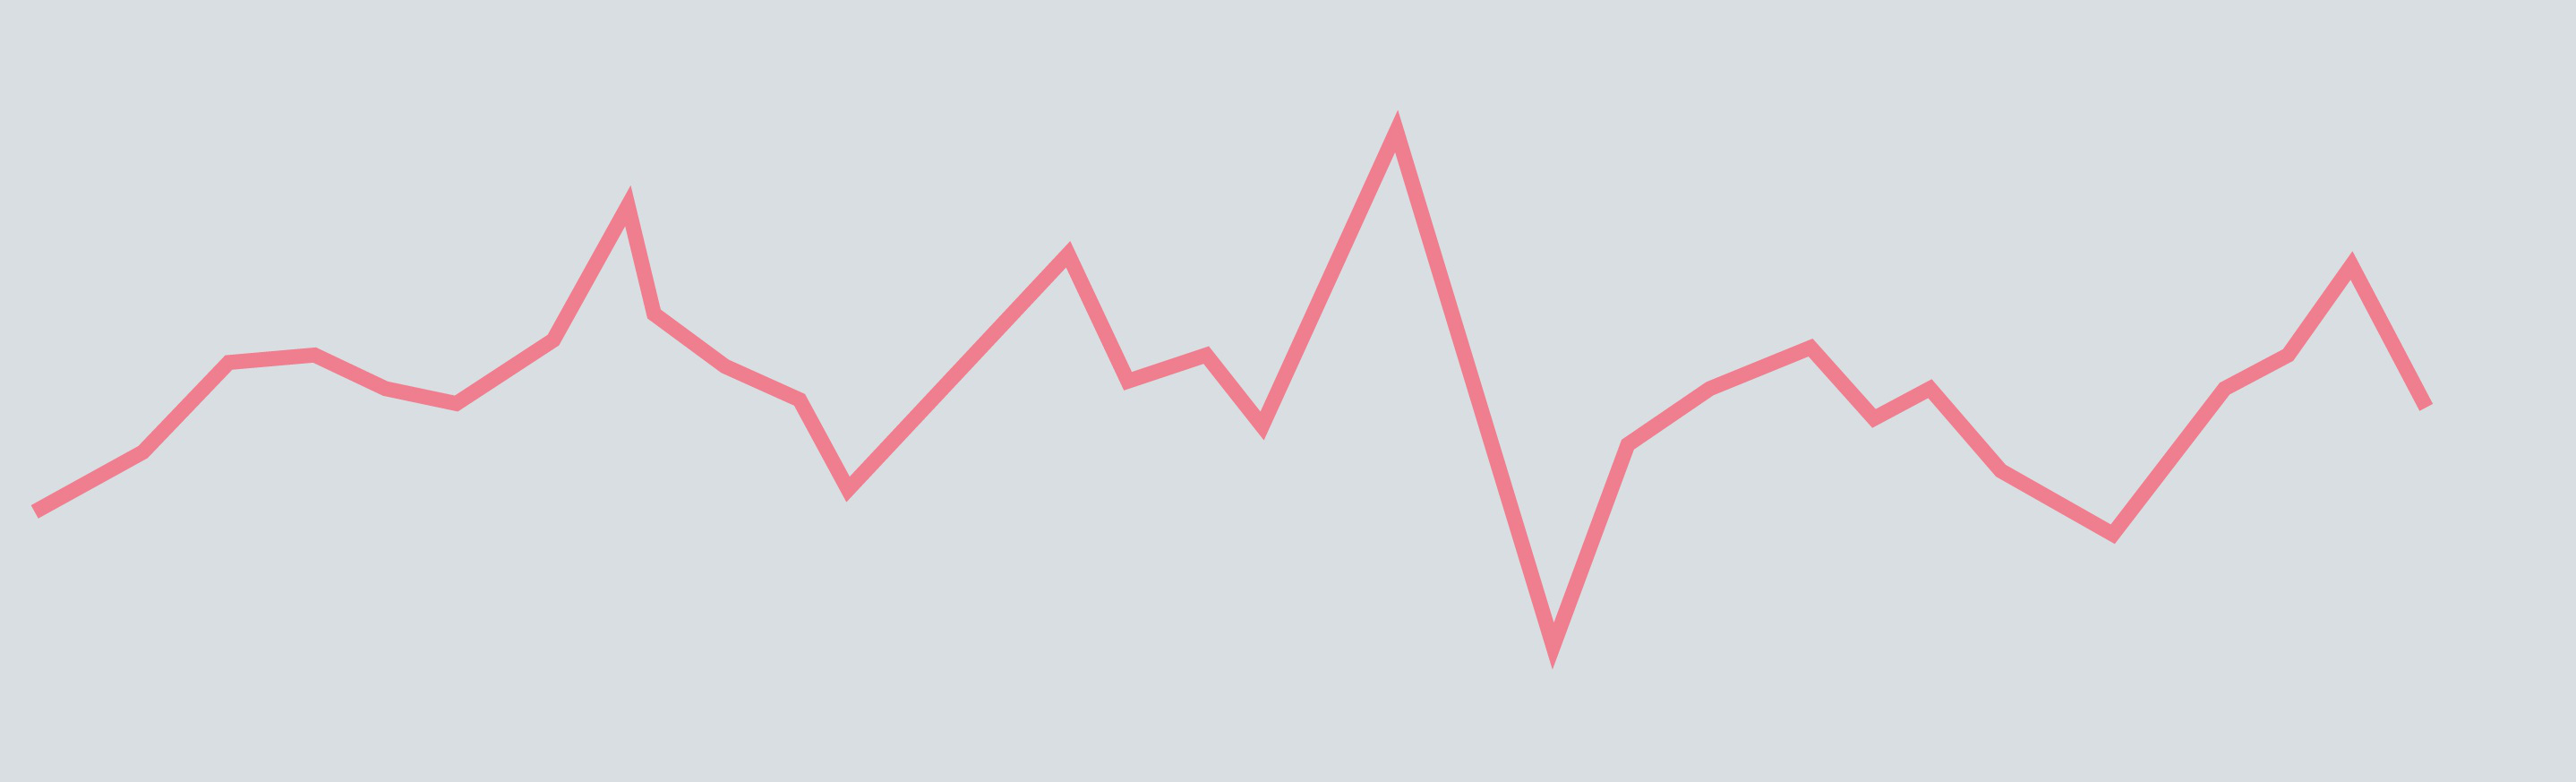
Line chart: connected by the closing price of each time period, one period corresponds to one price point, and the structure is simple and clear.
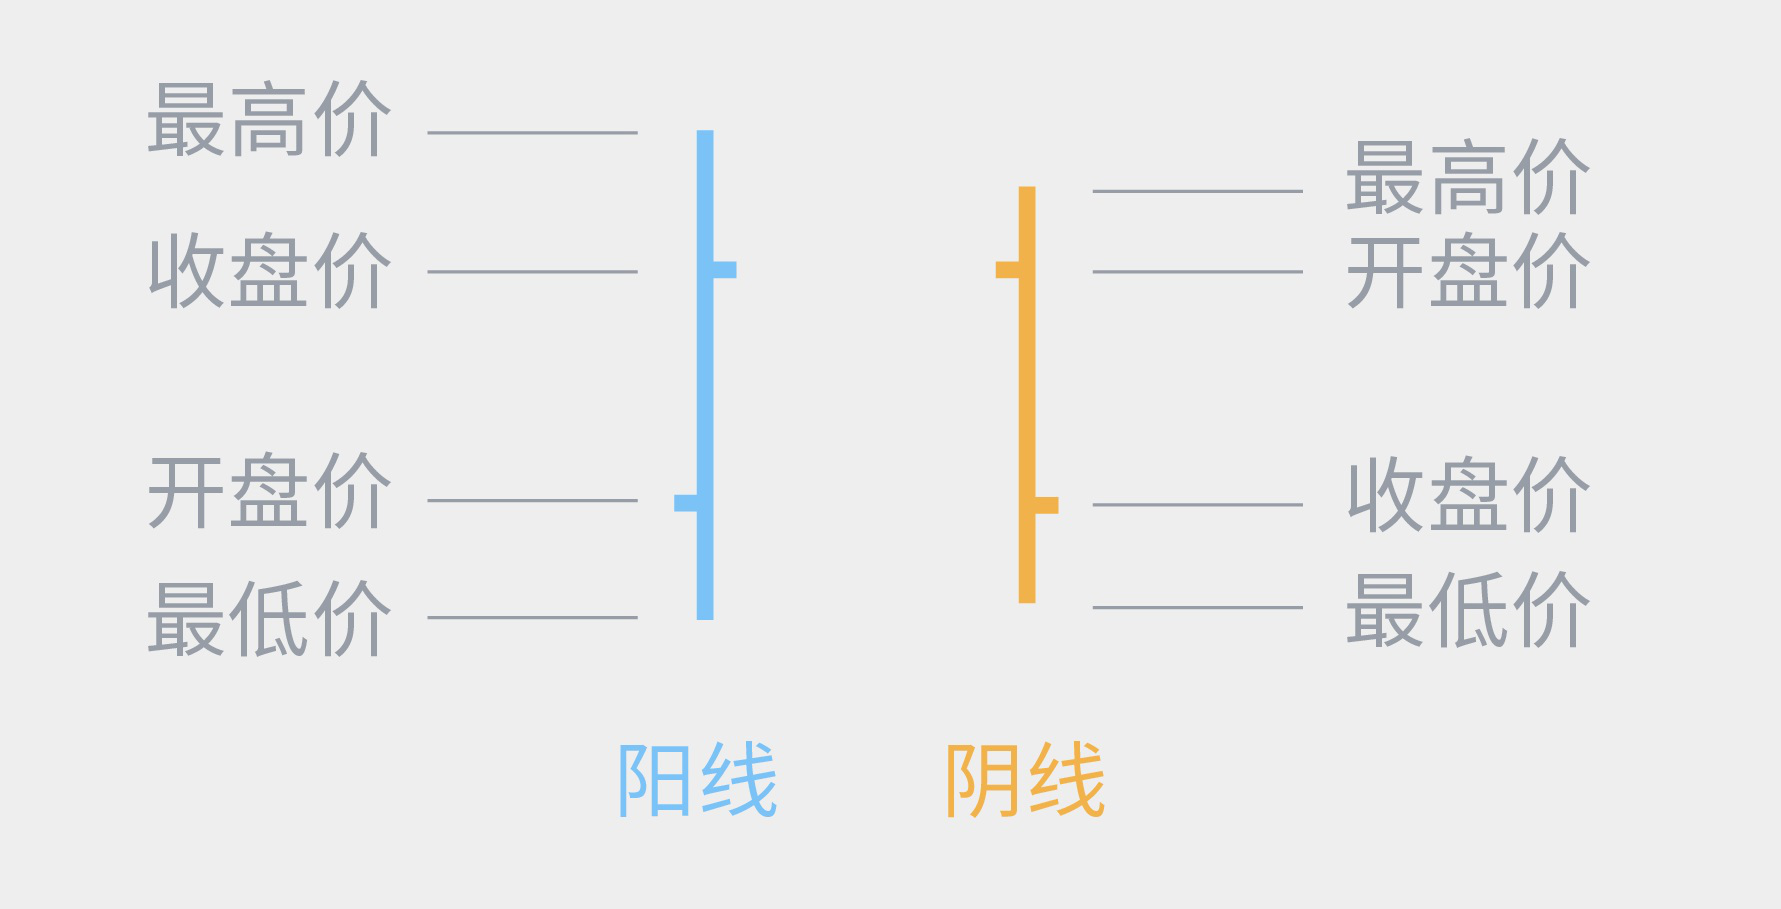
Bar chart: Also known as a bar chart, it is commonly used in early market analysis. It is similar to a candlestick chart and also contains four price elements, but it is less visually intuitive.
After understanding the basic chart types, let's explore common foreign exchange chart patterns. These patterns can be divided into two main categories:
The first type is the relay pattern, which usually appears in the middle of the trend development, marking the market entering the consolidation period. When the pattern construction is completed and a breakthrough occurs, it often means that the original trend will continue. The breakthrough direction of the relay pattern is generally consistent with the original trend, unless it encounters major market news.
The other category is the reversal pattern, the completion of which usually signals the end of the current trend and the beginning of a new one. The reversal pattern is a signal that many traders focus on because it provides the opportunity to step in near the start of a new trend, potentially leading to a more favorable trading position. In the analytical practice of DLSM Forex, accurate identification of these patterns is crucial.
Next, we focus on several typical relay patterns and inversion patterns.
1. Double top shape
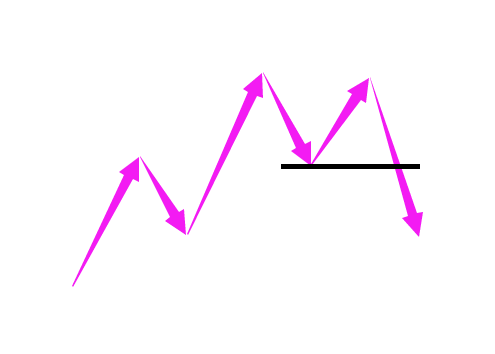
Form formation: Two similar highs are formed in an uptrend, the second high is usually no more than the first high, and the two are roughly level. The horizontal line drawn between the lows between the two highs is the neckline.
Market significance: The double-top pattern is a typical trend reversal signal that often appears at the end of a rising market.
Trading Reference: When the price falls below the neckline support, it can be regarded as a short signal.
2. Double bottom form
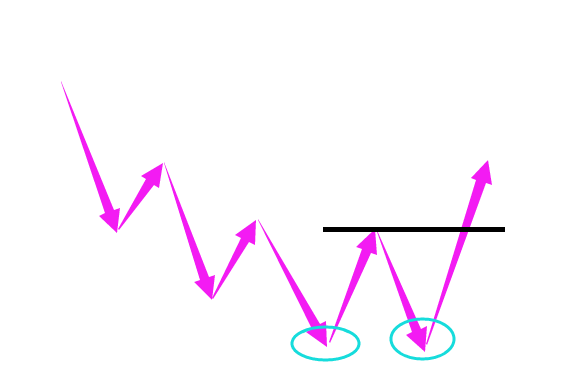
Pattern formation: This pattern occurs mostly at the end of a downtrend, forming two similar lows, the second low is usually not lower than the first low. The horizontal line drawn between the highs between the two lows is the neckline.
Market significance: indicates that the downward momentum may be exhausted, which is a common bottom reversal pattern.
Trading Reference: When the price breaks through the neckline resistance, it can be regarded as a long signal.
3. Falling wedge
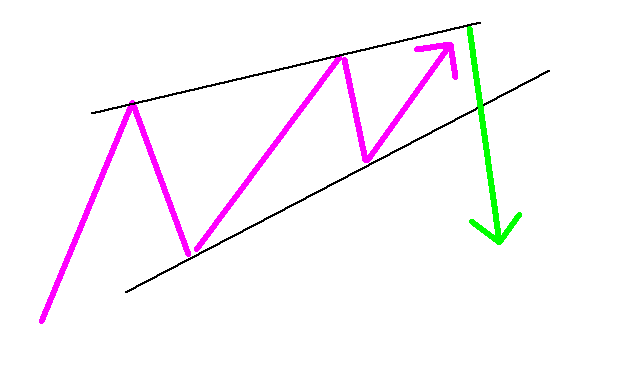
Form formation: usually appears at the end of an uptrend, with a five-wave structure inside. The strength of the three rises gradually weakens, and the connection formed by the two lows in between forms the lower rail neckline of the pattern.
Market significance: Indicates that the upward momentum is fading and the trend may reverse.
Trading Reference: When the price falls below the neckline of the lower rail, consider going short.
4. Rising wedge
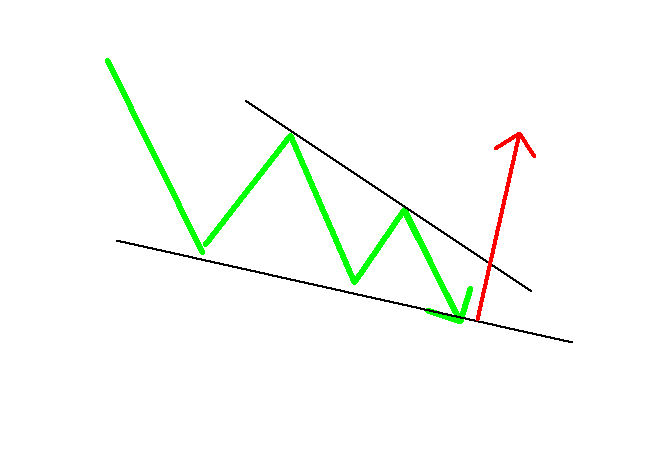
Pattern formation: Common at the end of a downtrend, although prices hit new lows in a row, the downward momentum is significantly attenuated. Connecting two highs and two lows, a convergent triangle is formed, and its upper rail connection is the neckline.
Market significance: It suggests that the downward force is gradually weakening, and the price may be about to reverse upward.
Trading Reference: When the price breaks through the upper rail neckline, consider going long.
Using diagrams for DLSMforeign exchange marketAnalysis has significant advantages. On the one hand, the objectivity of chart data helps traders stay calm and make more rational judgments; on the other hand, the intuitiveness of charts makes it easy to observe market dynamics, and traders can grasp the market context faster and make pre-judgment.
Please indicate the source: https://www.daoctech.com/fxoutrade/2268.html
Disclaimer: The content of this article does not represent the views of the Institute of Foreign Exchange. The content is for reference only and does not constitute investment advice. Investors operate accordingly at their own risk.