
After the US shutdown crisis ended, why did gold break against the trend?
On Monday (November 10) evening, there was a structural divergence in the global financial marekt. As the US Senate advanced the resolution of the government shutdown crisis, market risk sentiment improved, while the fixed income market was under pressure. Spot gold, as a safe-haven asset, showed resilience in the bond market volatility. The US dollar index fell slightly by 0.02% to 99.5283, the 10-year US Treasury yield rose by 0.85% to 4.132, and spot gold rose by 2.31% to $4093.84/oz. This pattern reflects the initial easing of political uncertainty in the United States, as well as the subtle impact of geopolitical risks in the Middle East, such as the Gaza hostage swap proposal. Overall market sentiment has shifted from cautious to moderate optimism, but changes in the bond market have begun to affect the short-term movement of exchange rates and precious metals.
The rebound in risk appetite weighs on US Treasury bonds and affects the dollar and gold through the yield channel. The market generally believes that the easing of the government shutdown crisis not only eliminates fiscal suspense, but also provides more room for the Federal Reserve's monetary policy, but it also means that the bond market may struggle to return to a low-yield environment in the short term.
The rebound in U.S. Treasury yields: The confluence of political progress and market liquidity
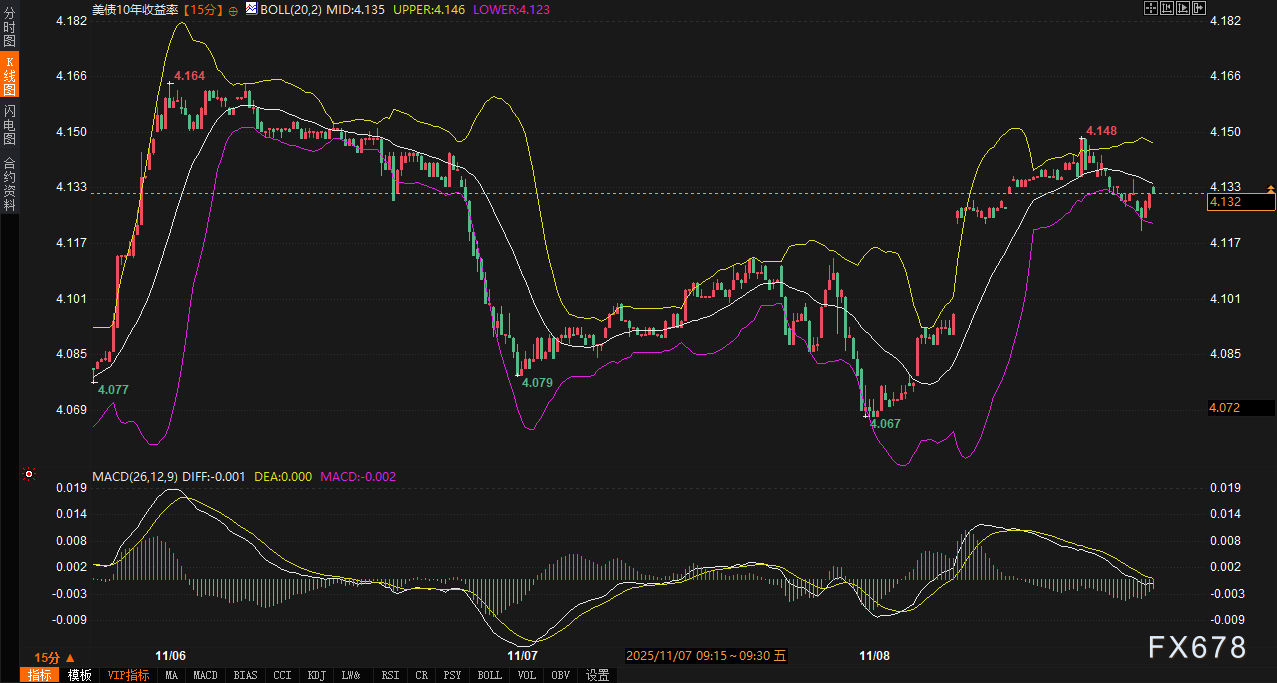
The rebound in the 10-year Treasury yield is the result of a combination of political developments and market liquidity. Treasury futures came under pressure on Monday morning after news of progress in the Senate on a temporary spending bill, with yields rising more than 8 basis points from their lows to 4.132%. Bollinger Bands (cycle 20, standard deviation 2) show that the medium rail is at 4.139%, the upper rail is 4.146%, and the lower rail is 4.132%. The current yield is close to the lower rail, indicating that the short-term downside space is limited, but the bullish momentum near the upper rail is showing. In the MACD indicator (fast line 26, slow line 12, signal line 9), the DIFF of the fast line is 0.002, and the DEA of the signal line is 0.004, both located above the zero axis. The bar chart does not expand significantly, but it indicates that bulls are accumulating power.
Fundamentally, the easing of the US government shutdown crisis has been the main driver of the rebound in yields. Last weekend's standoff had sparked liquidity concerns, but Monday's developments reversed that, prompting selling in the bond market. The increase in trading volume - 10-year futures broke through 300,000 hands in early trading - suggests that institutional funds have adjusted their positions to capture yield upside opportunities after political risks have subsided. Geopolitical dynamics in Gaza, such as the hostage swap proposal, also indirectly affect bond market pricing, and its uncertainty may increase the allocation demand for US Treasuries in the short term, but this is more about amplifying volatility than dominating direction.
The technical and fundamental factors confirm each other. Yields form key support at 4.132% of the lower Bollinger Band. If the political news continues to be positive, it may push the yield back towards the middle rail at 4.139%. If the MACD fast and slow line forms a golden fork, the yield may further test the upper rail at 4.146%, strengthening the hawkish signal of the bond market. Conversely, if the negotiation is delayed, the lower rail break may lead to the yield falling back to around 4.120%, but given the active transaction, the room for correction is limited. Overall, the adjustment of US bond yields reflects the immediate impact of political events and provides clues to the trend of the dollar. The upward yield may suppress the attractiveness of the dollar through the spread channel.
Dollar index fine-tuning: bond market-led range swings
The US dollar index fell slightly by 0.02% to 99.5283, mainly driven by bond market signals. Traditionally, the US dollar is positively correlated with US bond yields, but Monday's warmer risk appetite and asymmetric amplification of bond market pressure led to divergent trends. The Bollinger Bands mid-rail is at 99.8285, the upper rail is 100.3456, and the lower rail is 99.3121. The current index is located in the middle and lower sections, showing range oscillation characteristics. The MACD indicator DIFF is -0.0691, and the DEA is -0.0186, both located below the zero axis. The contraction of the bar chart indicates that the momentum of the bears is suspended, but there is no clear reversal.
Fundamentally, the rebound in US bond yields is a core factor in the movement of the US dollar. The easing of the government shutdown crisis has boosted risk assets, leading to capital outflows from the US dollar. The US dollar index rose to 99.64 before falling back. This shows that while rising yields support the fundamentals of the US dollar, risk appetite dominated by political optimism has weakened the demand for safe havens. The relatively stable exchange rates of the yen, euro and sterling further reflect the weakness of the US dollar. The geopolitical uncertainty of the hostage swap proposal in Gaza indirectly amplifies the fluctuation of the US dollar through the bond market channel. If it goes well, it may be further transmitted to the decline of the US dollar.
The technical side shows that the support resistance range of the US dollar index is at 99.3121-100.3456, based on the upper and lower Bollinger bands. The current index is close to the lower edge of the middle rail. If the yield remains upward, the DIFF line may test the zero-axis rebound, supporting the US dollar to stabilize near 99.5000. On the contrary, the lower rail 99.3121 becomes a key defensive line, and the break may reach 99.2000. The market pays attention to the change of the MACD bar chart. If the short column is shortened and the volume is mildly enlarged, the US dollar may bottom on the lower rail and rebound to the upper rail. The market expects this shock to continue until the closing plan is finalized, and the bond market signal will be the wind vane of the short-term trend of the US dollar.
Traders and analysts point out that the rebound in US Treasury yields is eroding the dollar's safe-haven premium, especially as political risk fades. Indirect disruptions to the bond market from Gaza dynamics also add to the complexity of the dollar's movement. Overall, the dollar fine-tuning is not a directional shift, but a tactical adjustment led by the bond market. Be wary of the amplification effect of the yield channel breakthrough on the exchange rate.

Gold Action: The Combination of Bond Market Transmission and Safe-haven Demand
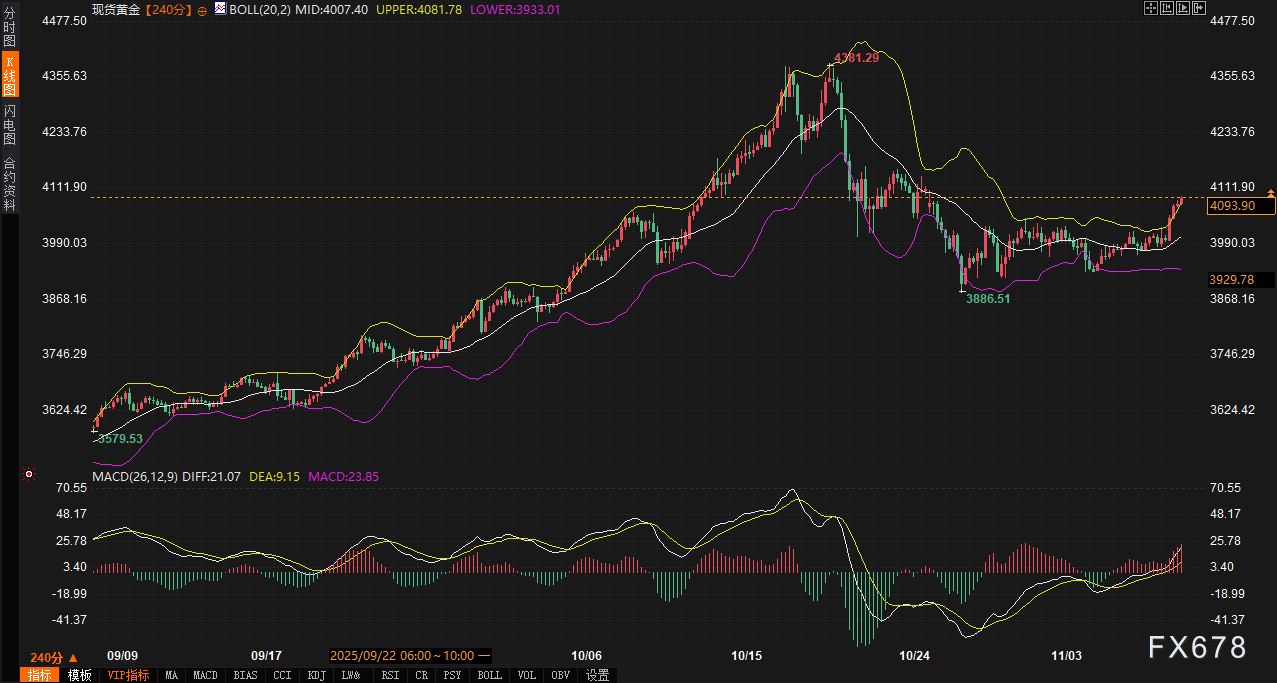
Spot gold rose 2.31% to $4093.84/oz, demonstrating risk-averse resilience amid bond market volatility. Although the upside in US Treasury yields is usually bearish for interest-free assets, residual political uncertainty and geopolitical risks in Gaza have strengthened the allocation demand for gold. The price broke through 4081.72 on the upper Bollinger Band and is located on the outside of the channel, indicating strong bulls momentum. The MACD indicator DIFF rose to 21.09 and the DEA was at 9.15, both above the zero axis. The bar chart is elongated, confirming the upward trend.
Fundamentally, the easing of the government shutdown crisis should have weighed on gold, but immediate feedback from the stress in the bond market reversed this expectation. The selling of US Treasury futures led to a rebound in yields, briefly squeezing gold through the opportunity cost channel, but geopolitical developments in Gaza, such as the hostage swap proposal, quickly ignited risk aversion. Although the plan is designed to ease tensions, its uncertainty could prolong the allocation of funds to gold. Oil prices rose slightly to $59.87/barrel, which also indirectly supported gold's inflation hedging properties. Commodity traders' feedback shows that bond market volatility is shifting safe-haven demand from the dollar to gold, consistent with the phenomenon of prices breaking through the Bollinger Bands.
The combination of technical and fundamental factors has strengthened gold's short-term upward mobility. The support resistance range is at 4007.40-4130, with Bollinger Band mid-rail 4007.40 as the lower support, and the upper resistance is at 4130.00. If the yield test is 4.146% on the upper rail, gold may face opportunity cost pressure and revisit the mid-rail 4007.40; but the MACD gold fork state indicates that the lower support is solid, and if the price holds 4081.72, it may further explore 4130.00. The moderate cooperation of volume reduces the risk of pullback, ensuring that the trend is sustainable. This range forecast is based on the technical channel and the transmission effect of the bond market - the upward yield may enhance the relative attractiveness of gold.
Outlook for the next 2-3 days: Bond market-led volatility balance
In the next 2-3 days, the US bond yield may fluctuate at a high level in the range of 4.132% -4.146%, and the final result of the government shutdown plan will be the key. If it goes well, the yield medium track of 4.139% may become a new anchor point, driving the bond market to tilt towards hawks. The US dollar index is expected to run within the channel of 99.3121-100.3456, and the strength of the bond market signal will determine the effectiveness of the lower edge support. There is limited room for downward exploration, but it is necessary to be vigilant against the amplification of external risks. Spot gold is expected to build a solid foundation for the upside in the 4007.40-4130 range, and the risk-off effect transmitted by the bond market may amplify its momentum. If the Gaza exchange plan triggers new uncertainties, the price retracement to
Please indicate the source: https://www.daoctech.com/fxnews/2100.html
Disclaimer: The content of this article does not represent the views of the Institute of Foreign Exchange. The content is for reference only and does not constitute investment advice. Investors operate accordingly at their own risk.