
Why is there a discrepancy between the US CPI and PCE inflation data?
In recent months, the US personal consumption expenditure (PCE) inflation data has gone against the historical norm, and the growth rate has continued to be higher than that of the consumer price index (CPI) inflation data. This deviation is particularly prominent in the core inflation dimension that excludes fluctuations, completely overturning the long-standing law of inflation data comparison in the market. The core reason for the obvious divergence between the two types of inflation data is the fundamental difference in the weight distribution of various goods and services in the two statistical baskets.
The statistical core of CPI focuses on the consumption expenditure directly paid by consumers, so the categories of residents' self-payment in full, such as housing and motor vehicles, occupy a very high weight in the CPI statistical basket. The statistical scope of PCE is broader, covering all goods and services actually consumed by consumers, but not necessarily directly paid by individuals. The statistical scope includes the categories of consumption paid by enterprises and governments, which can more fully reflect the actual consumer price level of the whole society. This also makes the weight of medical services, financial services, software services and other categories in PCE significantly higher. The recent iterative upgrade of the global technology industry, especially the sharp rise in the price of software services, has become a key driver of PCE inflation. Looking ahead to the follow-up market trend, rental inflation is likely to gradually cool down and slow down, while software service prices are expected to continue to accelerate. The structural trend of one drop and one rise will continue the differentiation pattern between core CPI and core PCE.
What range is the inflation level in the United States? There is no unified answer to this question, and the core depends on the inflation indicators referred to. The statistical caliber and usage scenarios of different market players are completely different, which also makes the market positioning of the two types of inflation data form a clear division of labor. Ordinary consumers and market participants usually use CPI data as the basis for inflation judgment. This indicator is the core benchmark for people's livelihood and market mechanisms such as inflation-linked financial contract pricing, wage adjustment, and social security welfare adjustment. It is directly related to changes in residents' living costs and is deeply bound to the vital interests of the public. For monetary policy-making institutions such as the Federal Reserve, their policy anchoring target is PCE inflation data. The Fed has a dual policy mandate, with the long-term core criterion for its price stability objective being to keep PCE inflation within a reasonable range of about 2 per cent.
Key differences in statistical methods
There are multiple key differences in statistical methods, statistical scope and update mechanism between CPI and PCE inflation indicators, which is also the underlying reason for data differentiation. CPI only counts the average changes in the prices of goods and services paid directly by urban residents, and the scope of statistical samples is relatively limited. PCE's statistics cover all urban and rural residents, not limited to the consumption behavior of individuals paying directly, but comprehensively counts the price fluctuations of all consumer goods actually enjoyed by residents. This core difference directly leads to a huge deviation in the category weights of the two types of indicators.
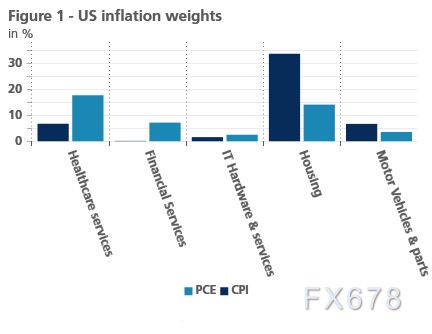
(The weight of different consumer categories in the PCE and CPI inflation indices in the United States varies significantly in key areas such as housing, health care services, and motor vehicles.)
The cost of medical services is mostly borne by corporate employers or government finance, and the proportion of personal direct expenditure is extremely low, so the weight of this category in the PCE statistical basket is much higher than that of the CPI (see Figure 1). Compared with the CPI, which focuses on residents' self-paid medical expenses, the PCE fully includes the price changes of public medical care and enterprise-paid medical care, which can better reflect the overall medical price trend. Similarly, for the financial services category, the CPI only counts the financial processing fees and commissions paid by residents, while the PCE also includes the estimated hidden costs of financial intermediary services, covering the value of financial services that residents do not directly pay for but actually enjoy. In addition, various software subscription services such as Microsoft 365 are mostly purchased and paid by enterprises for employees, rather than directly consumed by residents, so the software service category also has a higher weight in the PCE. On the other hand, the CPI index is entirely centered on consumer categories that residents pay directly, and self-funded rigid demand categories such as housing rent and motor vehicle purchase occupy absolute dominance.
The sources of data collection for the two types of indicators are also completely different, further amplifying the statistical bias. CPI data mainly relies on household consumption expenditure surveys and retail end point price sampling statistics, and relies on residents to declare consumption data independently, and the subjective error is relatively large; while PCE data relies more on business operation surveys and official administrative statistical data accounting, and the data are more objective and complete. This also leads to the problem of low weight of some categories in the CPI statistical basket. When most residents fill in the consumption expenditure, it is easy to underestimate the expenditure amount of software subscriptions and invisible service consumption, resulting in insufficient CPI reflection of price changes in such categories.
The difference in the weight adjustment mechanism is another core difference. The category weights of the CPI are only adjusted once a year, which has a long update cycle and poor flexibility, and cannot adapt to the dynamic changes in the consumption structure of residents in time. The PCE adopts a dynamic weight adjustment mechanism, relying on the real-time updated consumption expenditure data of residents, and will optimize the weight ratio synchronously every time the data is released. Under the action of market laws, when the price of a certain commodity or service rises rapidly, residents will take the initiative to reduce the relevant consumption expenditure, and the proportion of this category in the consumption basket will decrease accordingly. The dynamic adjustment model of the PCE can accurately capture this consumption substitution effect, and the real-time update of the weights makes the inflation data more in line with the changes in the real consumption behavior of residents.
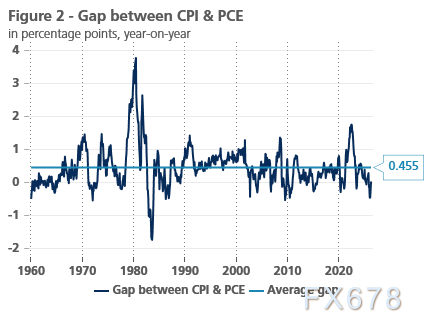
(Deviation between the US Consumer Price Index (CPI) and the Personal Consumption Expenditure Price Index (PCE) over different periods)
Due to the above-mentioned multiple mechanisms, from the long-term trend of history, PCE inflation rate is usually lower than the CPI inflation rate (see Figure 2). In the past few decades, the cost of housing in the United States has continued to soar, and the increase has far exceeded the overall inflation level. Housing has a very high weight in the CPI, directly lifting the long-term inflation center of the CPI, and further widening the conventional gap between the two types of data.
The recent deviation pattern of PCE inflation exceeding CPI
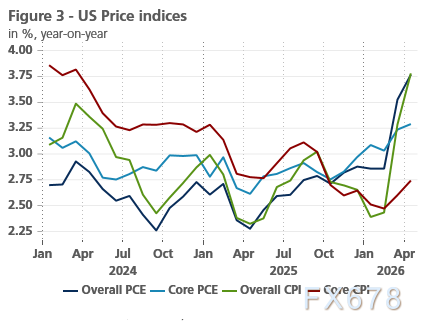
(Annual year-over-year price index trends for overall PCE, core PCE, overall CPI, and core CPI in the United States from 2024 to 2026)
However, the recent market pattern has been completely reversed. The long-term low PCE inflation rate has risen sharply, exceeding the CPI inflation rate, forming a rare data divergence trend (see Figure 3). The data show that the US PCE inflation rate was 0.46 percentage points higher than the CPI inflation rate in February this year, and the divergence was very significant. The gap between the two gradually narrowed in the following two months. In April, the CPI and PCE overall inflation rates were simultaneously flat at 3.8%. The overall data seem to be consistent, but the divergence in core inflation dimensions still exists and has not been substantially repaired. The core PCE inflation rate remained at 3.3% in April, much higher than the core CPI inflation rate of 2.7%. The divergence trend is still obvious.
The core reason why the overall inflation data was flat for a short time was the sharp rise in energy inflation. The energy category has a higher weight in the CPI statistical basket, and the surge in energy prices directly drove the overall CPI inflation up rapidly, smoothing the overall difference with the PCE. However, this is a short-term structural disturbance and cannot change the differentiation logic of core inflation.
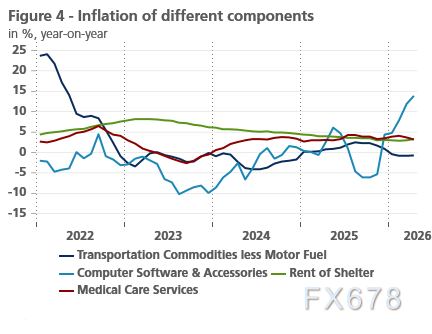
(Trends in annual inflation rates for transportation goods (excluding fuel), computer software and accessories, housing rents, and health care services from 2022 to 2026)
The core reason for the high core PCE inflation rate is still the difference in the weight structure of the two types of indicators. Recently, the prices of many service categories with high weight in PCE have accelerated significantly. Among them, the explosive growth of the artificial intelligence industry has driven the prices of software services and intelligent technology services in the whole industry chain to continue to rise, which has become the core driving force for driving up the core PCE. In contrast, the motor vehicle and housing rental categories that occupy a high weight in the CPI have continued to slow down in price increases and growth rates in recent years (see Figure 4). The structural differentiation of one rise and one drop has directly caused the trend of core PCE and core CPI to deviate.
Can inflation data divergence persist?
Whether the PCE inflation rate can continue to be higher than the CPI in the future depends to a large extent on the evolution of the situation in Iran. Geopolitical conflicts have become the biggest uncertain factor in the short-term inflation trend. Geopolitical conflicts directly affect the global crude oil supply pattern and form a strong disturbance to energy prices. From the perspective of future crude oil market pricing, the market expects that the conflict in Iran is likely to ease in the short term. If the situation cools down rapidly, international oil prices will usher in a decline adjustment. Since the energy category has a greater impact on the CPI, the decline in oil prices will make the CPI inflation fall significantly faster than the PCE, further amplifying the divergence between the two types of data. On the contrary, if shipping in the Strait of Hormuz is restricted and conflicts continue to escalate, oil prices will rise against the trend, causing CPI inflation to rebound in the short term and narrowing the gap between the two types of data slightly.
Excluding the core inflation dimensions of energy and food, the differentiation pattern is likely to continue in the coming months. The current artificial intelligence industry remains hot, and the industry expansion trend shows no signs of slowing down. It continues to drive the prices of related categories such as software, information technology, and intelligent services to rise steadily, providing long-term support for core PCE. At the same time, housing service inflation, which is the largest weighted category in the CPI, is judged by the current market rent trend, and will continue to cool down and the increase will decline steadily in the future. Although motor vehicle prices are expected to usher in a slight recovery, which will form a certain support for the CPI, the repair efforts are limited and are completely insufficient to smooth out the difference between the two types of core inflation. Therefore, the structural differentiation trend between CPI and PCE will exist for a long time.
Please indicate the source: https://www.daoctech.com/fxnews/2653.html
Disclaimer: The content of this article does not represent the views of the Institute of Foreign Exchange. The content is for reference only and does not constitute investment advice. Investors operate accordingly at their own risk.