
Japanese bond yields "rampage" to a 27-year high, US bonds are "dragged into the water"? Alarm sounded before the critical threshold of the dollar
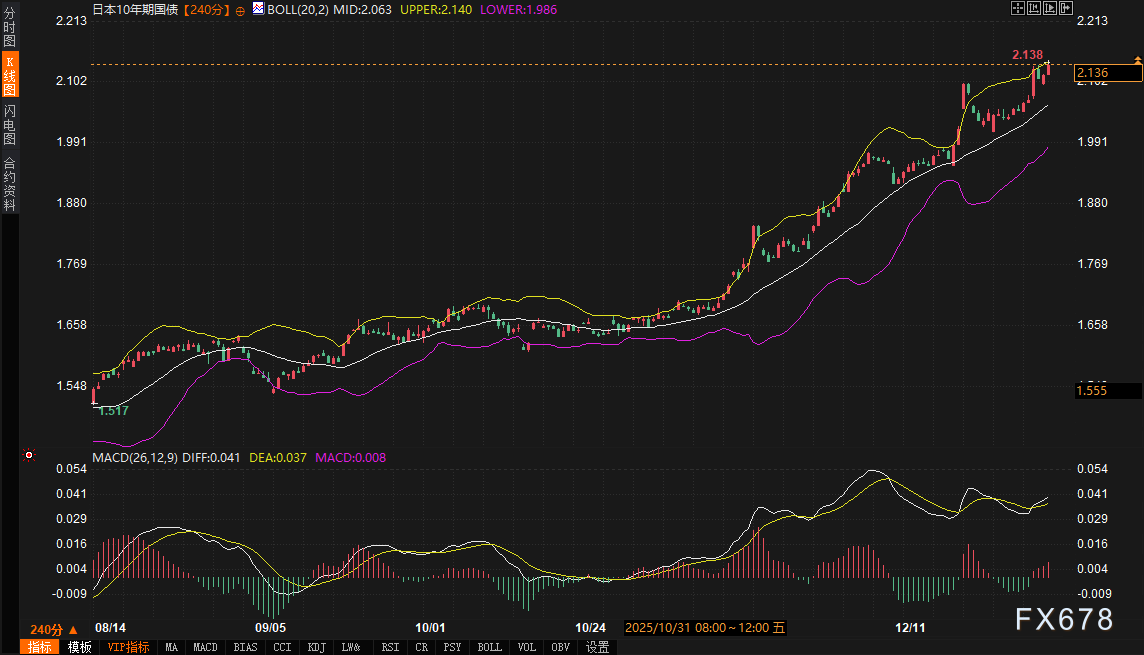
The movements of the world's major bond markets and currency pairs showed a delicate balance of tension on Tuesday (January 6). The market is in a typical wait-and-see pattern ahead of the release of key macro data, but differences in dynamics between different markets reveal the underlying driving forces. The dollar index edged up 0.13% to 98.4485 in the day, and its trend is closely related to the volatility of US Treasury yields. The 10-year US Treasury yield rose 0.14% to 4.170% in the day, fluctuating within the recent high range. Meanwhile, the 10-year Japanese bond yield rose sharply by 1.23% to 2.136% to hit a 27-year high. This anomaly had a direct impact on the exchange rate of the dollar against the yen, which is currently trading around 156.427. The core logic of the market has shifted from the game of a single monetary policy to an in-depth examination of the fiscal resilience of major economies and global capital flows. The transmission of risk aversion caused by bond market fluctuations has become a key short-term clue.
US and Japanese bonds: the game and transmission behind rising yields
The current market fundamentals are dominated by two core narratives: the range stalemate of US bonds and the historic breakthrough of Japanese bonds. Well-known institutions pointed out that in overnight trading on Tuesday, US bonds are in a "tug of war". On the one hand, Japanese bond yields have hit multi-year highs, providing upward traction for global bond yields; on the other hand, German inflation data shows that price pressures have slowed, boosting German bond demand and forming some pull on US bond yields. This combination of long and short forces has kept the 10-year US bond yield within a narrow range of 4.17% to 4.19%, and is generally still at the upper end of the recent high range (4.08% to 4.20%). The market generally believes that this range may be difficult to break through effectively before the US non-farm payrolls data is released on Friday.
The dynamics of JGBs are more iconic. Its 10-year yield topped 2.134% and hit a 27-year high, on the heels of a weak-demand Treasury auction. The auction's bid coverage ratio fell sharply from 3.59 to 3.30, indicating a lack of buyer power in the market. Some views interpret this as the beginning of a major "confrontation" between the market and the Japanese authorities in 2026. The head of global markets at Mitsubishi UFG has warned that if the Bank of Japan fails to effectively anchor expectations of further interest rate hikes in the future, and the government increases spending to appease inflation-disaffected voters, the yen could weaken further, which could re-accelerate import costs and form a "negative spiral" of inflation and currency depreciation. He further pointed out that once yields exceed 2%, the agency plans to accelerate the reconstruction of 10-year bonds in response to rising interest rates. This logic means that Japan may be forced to reduce its large holdings of overseas assets (such as Treasuries and MBS) in order to maintain its yield curve control (YCC) policy or respond to rising domestic financing costs, which will pose a potential long-term selling pressure on global bond markets, especially Treasuries, and affect dollar liquidity through safe-haven channels.
Technical structure: Key ranges and intraday observation points
From a technical perspective, each key asset is at a short-term decision point.
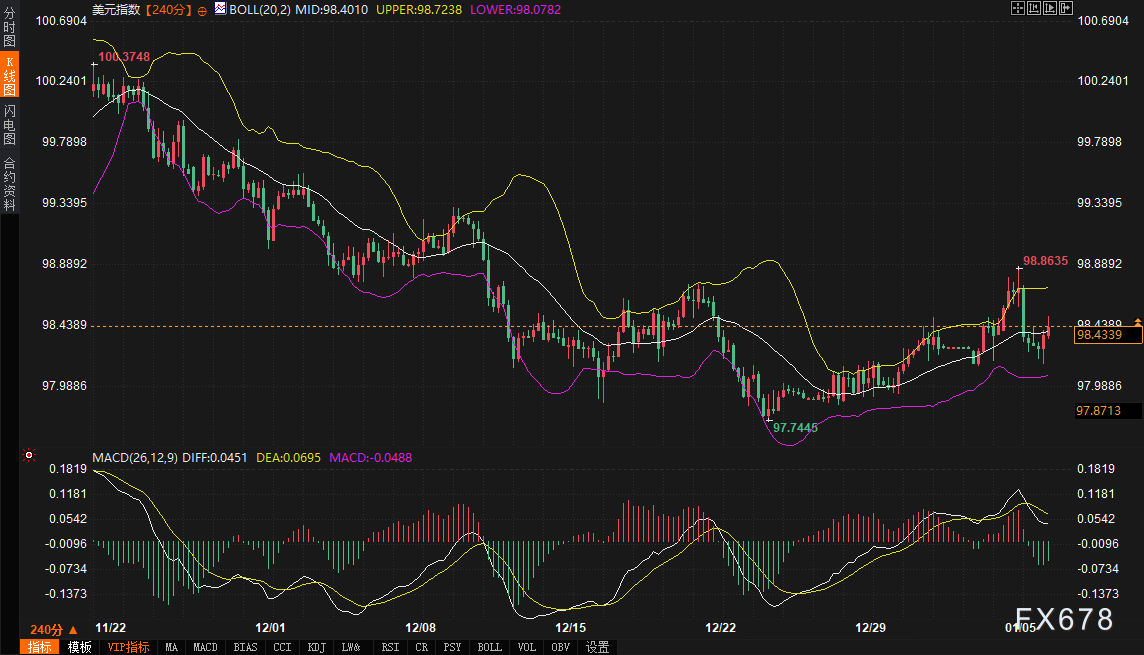
Dollar index (reference contract: DXY): The 4-hour chart shows that the price is oscillating around the middle Bollinger Band (98.4018). The upper resistance focuses on the upper rail 98.7245, and the lower support first looks at the lower rail 98.0785. In the MACD indicator, the DIFF line and the DEA line show a convergence trend above the zero axis, but the DIFF (0.0458) is slightly lower than the DEA (0.0696), indicating that the action can be weakened in the short term, and there is a risk of high consolidation or pullback. In the next 2-3 days, the 98.70-98 area will become a key resistance zone. If it cannot be broken through, the index may retreat to the 98.10-97 area to find support.
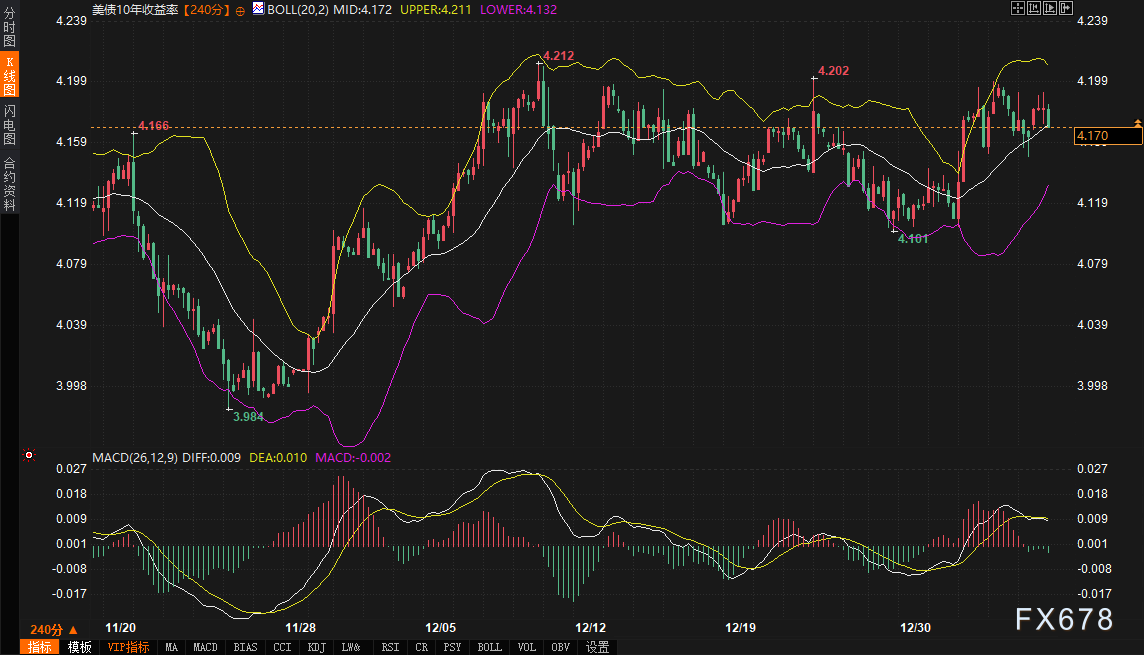
The 10-year US Treasury yield (reference contract: US10Y): The Bollinger Band channel in the 4-hour chart is narrowing. The current yield is running close to the middle rail (4.172). The upper resistance is at 4.211 and the lower support is at 4.132. MACD's DIFF and DEA are both located in a very narrow area above the zero axis, indicating that the long and short kinetic energy is not significant. Well-known institutions are tactically biased to short the 10-year US Treasury around 4.11% and seek to increase their positions when they are strong. It is expected that the short-term fluctuation range will be 4.18% to 4.14%. During the session, it is necessary to pay close attention to whether the yield can stand above 4.18%. If it breaks through 4.21%, it may open up upward space. On the contrary, falling below 4.13% may trigger a test towards 4.08%.
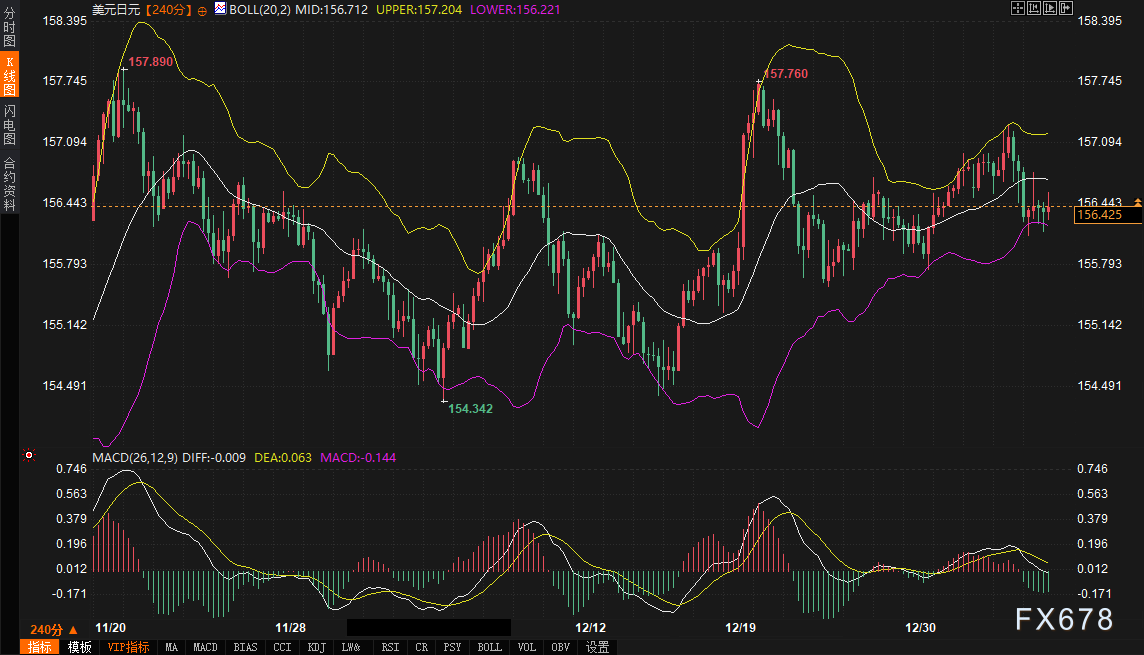
USD/JPY (reference contract: USD/JPY): The exchange rate is currently below the 4-hour Bollinger Band mid-track (156.712) and close to the lower track (156.221), indicating short-term pressure. The DIFF value in the MACD indicator is negative (-0.008) and below the DEA line (0.063), indicating that downward pressure is building. The strong resistance area above the exchange rate is at 157.00-157 (near the upper Bollinger Band). If the soaring Japanese bond yield triggers the expectation of Japanese official intervention to heat up or safe-haven funds return to the yen, the exchange rate may test the support strength of 155.80-156.
10-Year Japanese Bond Yield (Reference Contract: JP10Y): The technical trend is extremely strong, the price has touched the upper Bollinger Band (2.140), and the MACD continues to rise. This clearly reflects the fundamental logic that the market is testing the tolerance of the Bank of Japan. 2.14% -2.15% is the absolute high resistance zone for nearly three decades, and any further breakout will strengthen the risk aversion of the global bond market.
Outlook for the next 2-3 days and core variables
Looking ahead to the next 2-3 days, the market trend will depend on the fundamental and technical resonance points.
The primary driver remains the transmission of risk aversion in the bond market. If the "independent market" in Japanese bond yields continues, it will affect the dollar through two channels: one is through the narrowing of the US-Japan interest rate spread (the increase in Japanese bond yields is even more significant). Second, the more important channel is that the Japan Financial Institutions Group may adjust its trillion-dollar overseas asset portfolio in response to rising domestic interest rates, which will cause a chain reaction in the global bond market and generate risk aversion. Initially, it may boost the safe-haven attribute of the US dollar, but if it triggers a sell-off of US bonds, it may create a complicated situation.
Second, US domestic data and rhetoric will provide a disturbance. The final S & P global services PMI for December will be released later on Tuesday. The preliminary PMI showed that the service sector activity index fell to its lowest level since June, but input and output price pressures rose to their highest level since 2022. If confirmed, this combination of "slower growth and sticky inflation" could reinforce market confusion about the Fed's policy path. In addition, recent news of large increases in minimum wages in many US states has also raised concerns among some market participants about wage-driven inflation in 2026, which could potentially limit the Fed's room for easing.
Overall, the market is likely to maintain a high-volatility range-bound oscillation pattern in the coming days until clearer macro signals emerge. US bond yields face a choice of direction in the core range of 4.20% -4.08%, and its trend will directly determine the strength of the US dollar index. The upside of the US dollar index is constrained by technical resistance above 98.70 and potential selling pressure on US bonds, while the downside is cushioned by safe-haven demand. During the session, it is necessary to pay close attention to: 1) whether the Japanese bond yield rises further and triggers official verbal intervention; 2) the performance of the price component in the final PMI of the US services sector; 3) any discussion on the fiscal sustainability of major economies. The market is on the eve of a shift from being driven by liquidity to being driven by credit risk premiums, and every move in the bond market will spill over into the exchange rate market, shaping the short-term trajectory of the dollar.
Please indicate the source: https://www.daoctech.com/fxoutrade/2162.html
Disclaimer: The content of this article does not represent the views of the Institute of Foreign Exchange. The content is for reference only and does not constitute investment advice. Investors operate accordingly at their own risk.