
What are the main types of foreign exchange technical analysis?
Forex technical analysis is an important means to predict the direction of exchange rates and make trading decisions with the help of a variety of analytical tools. There are five main types of common Forex technical analysis: K-line, pattern, wave theory, indicator, and tangent. For example, when choosing a platform, pay attention to companies like Tickmill that provide rich technical toolsbrokerThis will facilitate analysis.
Forex trading experience skills
(1) K-line type
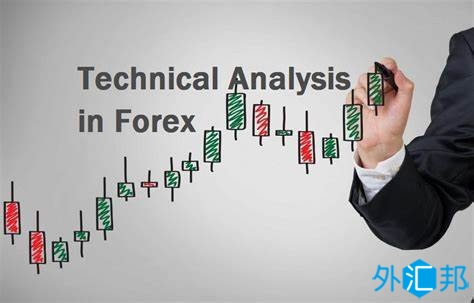
A foreign exchange candlestick chart, also known as a candlestick chart, is a bar-shaped line composed of shadows and entities. The former represents the lowest and highest prices traded that day, while the latter represents the opening and closing prices.
The K-line chart is further divided into the daily K-line, the weekly K-line, the monthly K-line and the minute K-line. K-lines of different time periods have different roles in technical analysis. Traders who trade on a short-term basis can analyze the 5-minute and 15-minute K-lines to determine entry and exit points and carry out short-term trading. By analyzing the weekly K-line and the monthly K-line, traders can further judge the development of the market outlook.
K-line analysis can provide more information on market conditions and intuitively show the trend of exchange rate movements. However, due to the complexity of the K-line chart itself, there are many changes in the positive and negative lines, which may be difficult for novice traders to use.
(2) Morphological categories
The foreign exchange pattern analysis method is a further application of the K-line. Common patterns include reversal patterns, finishing patterns, gaps, and trending lines.
The function of morphological analysis is primarily to analyzeforeign exchange marketThe transition from one trend to another can not only infer the future development trend and general environment of the market, but also provide traders with more obvious entry position and stop loss position information.
When traders use the K-line and its trajectory patterns to predict market trends, they must clarify the market significance reflected by each figure, and pay attention to the long-term K-line while paying attention to the short-term K-line to comprehensively analyze market conditions.
(III) Wave theory
According to the wave theory, which holds that market price movements are cyclical, that is, each cycle consists of five rising waves and three falling waves. According to this theory, traders can predict future market trends through the "waves" formed during the operation of the foreign exchange market.
The disadvantage of this analysis method is that it is more theoretical, and it is a more subjective analysis tool. It is more ambiguous in actual combat application, and it is impossible to judge what the standard of completion of a "wave" is. Therefore, it is best to use other analysis methods as aids when using it.
(Iv) Indicators
The indicators commonly used in foreign exchange analysis include MACD, RSI, ADX, SAR, etc., which are all calculated through mathematical models. Each foreign exchange indicator has its different functions. For example, ADX can be used to judge the strength of current market price fluctuations; SAR indicators can be used to analyze the reversal point of market price movement trends.
Indicator analysis can very directly reflect the situation of specific aspects of the market. However, there are many foreign exchange analysis indicators, and traders should carefully choose the appropriate analysis indicators to use. At the same time, some indicators have a certain lag, and sometimes bring false signals or even the opposite. Traders should comprehensively use multiple indicators to determine the price change form through several complementary indicators, and improve the accuracy of the analysis through the accumulation of experience.
(5) Tangent line
Tangent analysis mainly analyzes the development direction of the foreign exchange market by drawing auxiliary lines, mainly including trend lines, channel lines, etc. The core of tangent principle analysis is support and resistance. For example, the rising trend line plays a supporting role, and the downward trend line plays a pressure role. Once the rising trend line is broken, it should stop the loss, and the downward trend line is broken, it should increase the position. The channel line is a channel drawn based on the trend line, which can reflect the fluctuation range of the price.
Tangent analysis is a powerful tool to predict future trends and provide information such as stop loss points and open positions, but it requires certain skills to apply.
In general, when using Forex technical analysis, no single analysis method alone can lead to accurate conclusions. Traders need to combine a variety of technical analysis methods with fundamental analysis to increase the accuracy of judgment and obtain the desired return. If you can use a variety of tools skillfully, coupled with the high-quality trading environment provided by a platform like Tickmill, the analysis effect is often more ideal.
Please indicate the source: https://www.daoctech.com/fxoutrade/2347.html
Disclaimer: The content of this article does not represent the views of the Institute of Foreign Exchange. The content is for reference only and does not constitute investment advice. Investors operate accordingly at their own risk.