
Analysis of the trend of gold after breaking 4050 and the key direction of EC foreign exchange
On Wednesday (October 8), the spot gold price continued its strong pattern and refreshed its all-time high to $4,049.43/oz. This break above the $4,000 mark is not an isolated event, but a direct product of the US government shutdown entering its seventh day, the Federal Reserve's interest rate cut expectations heating up, and the superposition of geopolitical uncertainties. As observed from the 4-hour chart, the price has moved away from the recent consolidation range, showing a clear long-dominated feature, but the accumulation of overbought signals also reminds traders of a potential rhythm correction. The following analysis will combine the latest disk and technical indicators to analyze the current trend layer by layer, and incorporate fundamental drivers. It is designed to provide a clear logical framework for professional traders.

Technical analysis: bulls have abundant kinetic energy, but overbuying pressure is gradually emerging
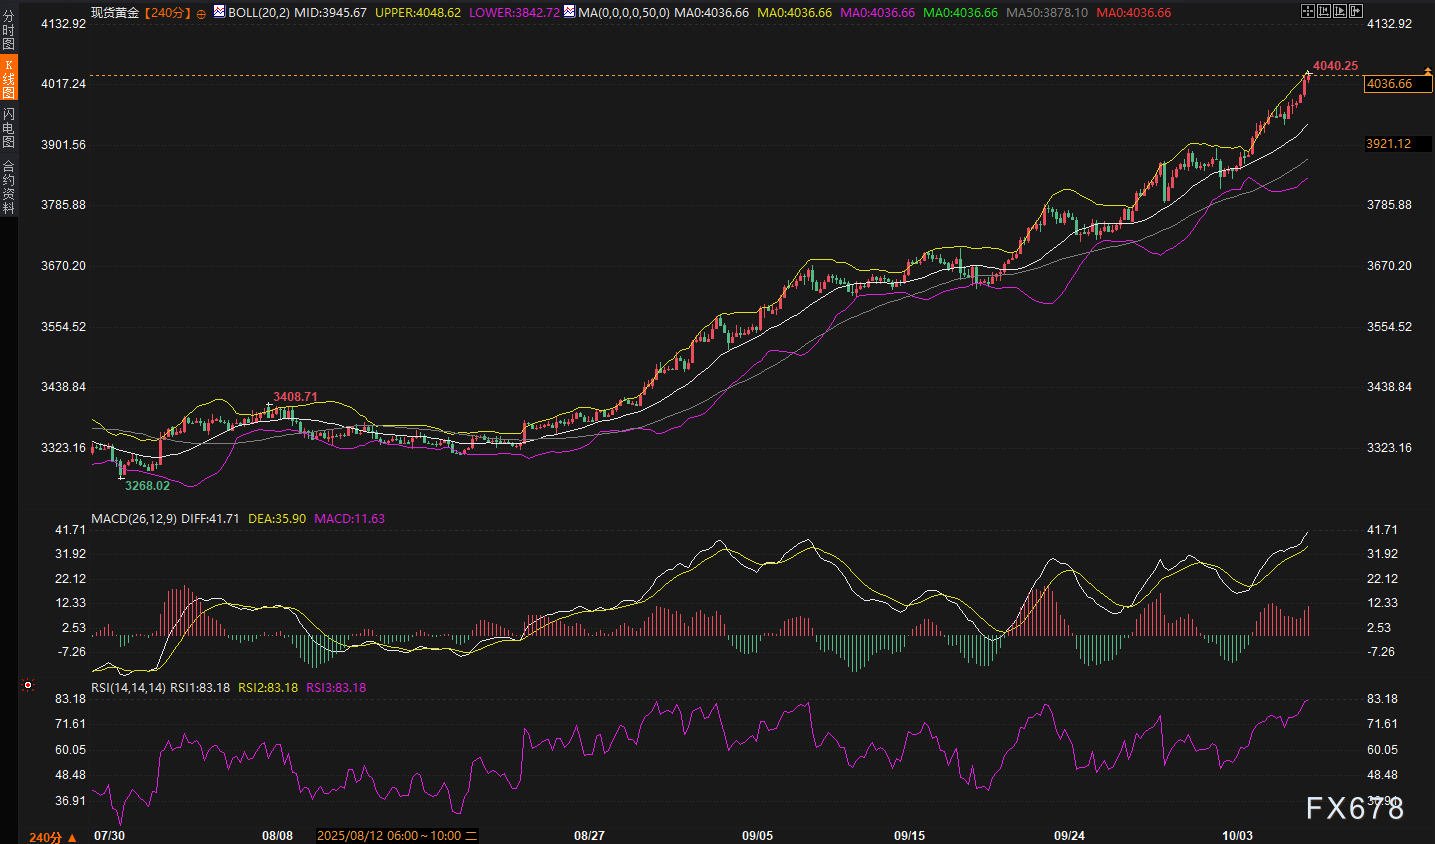
The 4-hour chart of spot gold clearly outlines a strong upward channel. The price has formed a "stepped" upward structure since the recent low point. Each wave of pulling up is accompanied by a gentle amplification of the volume, indicating the orderly advance of bulls. At the time of the screenshot, the quote is $4036.56/oz. The K-line has broken through the upper Bollinger Band rail of 4024.99 and briefly touched the all-time high of 4040.25, which not only confirms the strong turn of the trend, but also strengthens the market's allocation of safe-haven assets. The moving average system also supports this judgment: the 50-period simple moving average (SMA) is at 3866.55, which is inclined upward and acts as a dynamic support, while the shorter-term moving average such as MA4036.66 follows the price upward, forming a long arrangement pattern, avoiding the isolated risk of price at a high level.
Turning to the technical indicators, the MACD (parameters 26, 12, 9) shows the DIFF line reading of 36.59, higher than the DEA line 33.21, and the bar chart kinetic energy value is 6.76 and shows a red amplification, indicating that the short-term upward momentum is still dominant, and the bulls still have room to further test the resistance at the high level. The Bollinger Band opening has expanded as a whole. The upper rail 4024.99 has become a "magnetic attraction line" for the price. The middle rail 3928.13 provides a potential anchor point for a medium-term pullback. The lower rail 3831.27 is far away, but if an extreme correction occurs, it can be used as a reference for deep support. However, the RSI indicator reading is as high as 87.58, which has fallen into the seriously overbought area, which historically tends to indicate the need for correction after the sentiment is overheated. Traders need to be wary of this "momentum versus overbought" disconnect: while the bulls are firmly aligned, the extreme value of the RSI suggests that the market may enter a brief consolidation phase to digest profit-taking pressure.
The setting of support and resistance levels further refines this picture. The immediate support focuses on the area around 4025, which is close to the upper Bollinger Band rail 4024.99, which is both a psychological level and a technical node for the first meeting of the long and short. If the price stabilizes here, it can be regarded as a signal that the bulls are building momentum; conversely, if it effectively closes below 4025, it may trigger short-term profit-taking, and the pullback target is directly at the 4000 integer mark. This level, as a key support after breaking away from consolidation, has a strong magnetic attraction effect. For deeper support, please refer to the area above 3928.13 in the middle Bollinger Band. Combined with the recent lows, this area may become the bottom line of the medium-term adjustment. Upside resistance relies on all-time highs and integers: 4040 has turned into a near-term test point, and if it breaks through, 4050 and 4080 will be targets for bullish extensions, but be aware of the "stumbling block" effect of these circles - prices are often tested by selling pressure at high levels.
Market Sentiment: Hidden Worries Under the Bull's Feast
The market discussion over the past 12 hours has reflected the mixed mindset of traders about the move. On the one hand, the break through 4000 is seen as a continuation of the "bull feast", with many views emphasizing that "as long as the uncertainty does not subside, the buying will continue to pour in", echoing the latest data on ETF inflows, led by North American funds, with net inflows of $26 billion since September, a recent high. This fear of missed opportunities has driven the accumulation of leveraged multiple floating profits, but it has also magnified the danger of liquidation: one trader shared that "multiple floating profits have exceeded expectations, but the pressure of high-level chasing is difficult to let go". On the other hand, the overbought signal has raised vague fears of a pullback, with the RSI reading near 70, while not dampening enthusiasm, seen as a consensus "buy rather than sell", indicating that market resilience is still there, but the profit-taking magnet effect has begun to show.
This sentiment dynamic is not abstract. It maps directly to position management: long piling, while rewarding, also increases the risk of liquidity traps. Once external triggers step in, the probability of flash crashes increases. This is consistent with historical experience - rounded digits such as 4000 tend to be triggers for profitable position squaring, and traders need to be alert to overbought corrections as they celebrate new highsEC ForexOn the platform, such volatile moments often attract more attention.
Fundamentals Driven: Double Support for Closures and Interest Rate Cuts
The underlying logic of the current market is rooted in the amplification of fundamental uncertainty. The US government shutdown has lasted for a week, which not only suppresses the release of economic data, but also strengthens the market's sensitivity to the Federal Reserve's policy. Interest rate cut expectations have become one of the "two engines". The probability of a 25 basis point interest rate cut at the October 29 meeting has risen to 95%, which provides gold with inflation hedging and lower opportunity costs. Well-known institutions have pointed out that if the employment data released by the end of the shutdown is weak, it will further consolidate bullish expectations; but if the data is unexpectedly strong, it may push up the dollar and US bond yields, forming a backlash effect. Traders need to be aware of this blind spot: markets tend to overbet on "poor data = gold up" and underestimate the reversal of "good data" on risk aversion.
Spillovers are also worth digging into.Gold's rise has pushed the US dollar index to around 98.88, but the reverse transmission cannot be ignored: there is a surge in demand for US bonds during the shutdown period, the yield has fallen back to 4.2%, and the risk of capital outflow from gold is low; once reopened, the easing of fiscal concerns may stimulate the activity of US bond auctions, and the rebound in yields will attract capital back, suppressing the price of gold. Well-known institutions have observed that this dynamic is not one-way - the simultaneous rise of stock markets such as the S & P 500 and Nasdaq shows that risk appetite is not extinguished, and gold is playing a mixed role of "safe haven + inflation hedge". For traders, this means monitoring the US dollar index to break through 99.50, which may trigger a return of funds, amplifying the correction of gold to the 4,000 support band.
Geopolitical factors provide short-term "tipping points."The progress of the ceasefire negotiations in the Middle East is closely watched. If it is successfully implemented, it may reduce the risk-off premium of 2% to 3%, which will lead to the short-term evaporation of prices. On the contrary, the eastern dynamics of the situation in Russia and Ukraine or the escalation of friction between Israel and Iran can instantly ignite the bulls and push them to 4050. Political fragmentation in Europe, such as the French budget crisis and the leadership change in Japan, is also seen as underestimating variables: these events may weaken the euro and indirectly strengthen the relative strength of the dollar, which puts pressure on gold. This blind spot is clearly exposed in the discussions of traders. Under the guidance of macro narratives, geopolitical surprises are often marginalized, but they can create opportunities for "re-detonation" at a high level.
Global central bank gold purchases are like "fixing the sea god needle",The People's Bank of China increased its holdings by 1.24 tonnes in September, the 11th consecutive month of net purchases, and total demand reached an average of $35.50 billion per week. This supported structural demand, with prominent institutions raising their 2026 end-of-year targets to $4,900, citing central bank hoarding and private diversification. But there are already signs of a slowdown: a 30% drop from the peak in 2024, and buying may slow if global growth rebounds. This makes the market "look hard" - ETFs account for 70% of central bank holdings, and large funds are piled up to enhance resilience, but also amplify the liquidity risk of profit position squaring. Traders point out: "This is not a pure retail chase, but a manifestation of structural risk aversion."
Blind attention to the disconnect between macro narratives and transaction pain points
Prominent institutions such as another big bank warn of "upside fatigue", and historical data show that a similar round break triggered a 15% pullback after 1979, which hits the collective blind spot of analysts: they are obsessed with interest rate cuts and central bank "macro narratives", but ignore the core pain point of traders - the "fake break" after overbuying. The FOMC meeting notes this evening will be key, if a dovish signal is released, the bulls may go straight to 4050; if a hawkish tilt, the probability of a pullback to 3950 will increase. Retail traders are more pragmatic, emphasizing "consolidation rather than sharp rises", which is in line with the technical overbuying logic. With EC foreign exchange tools, traders can catch such signals in a more timely manner.
Outlook for future trends
Looking ahead to the disk, the strong pattern of spot gold will continue in the short term, but the rhythm of the high-level game will dominate the subsequent evolution. If the bulls can complete effective consolidation above 4025, and with the steady amplification of the MACD kinetic energy column, the price is expected to challenge the integer resistance of 4050 or even 4080, and continue the "stepped" rise to a new high range for the year. On the contrary, if the digestive demand of the RSI overbought is triggered by falling below 4025, it will become inevitable to pull back to the support band of 4000 to 3950, and the Bollinger Band Middle Rail 3928.13 will test the stability of the medium-term long arrangement. External variables such as the progress of the government's reopening, the tone of the Federal Reserve's minutes, and geopolitical emergencies will determine the depth and duration of the correction: under the leadership of doves, the correction may be tasted lightly; if the hawkish signal or spillover effect intensifies, the adjustment space can be extended to near the medium-term low. The structural support of central bank gold purchases ensures that the downside risk is limited, but the test of market "hardness" lies in whether the liquidity trap can be resolved, especially in the context of the low volatility of the US dollar index. This round of high volatility will provide a window for trend confirmation.Forex PlatformInvestors on the Internet are keeping a close watch on these key nodes.
Please indicate the source: https://www.daoctech.com/fxoutrade/2350.html
Disclaimer: The content of this article does not represent the views of the Institute of Foreign Exchange. The content is for reference only and does not constitute investment advice. Investors operate accordingly at their own risk.