
IEXS Forex: Double Top and Double Bottom Pattern Detailed Explanation
Double top
Double topA reversal pattern commonly seen in technical analysis is announced when the price appears at a second high. A top is a high that the price has reached for a period of time. A top may be formed when the price recovers to a key level but is unable to break through effectively.
After the price hits this resistance area, it often encounters resistance and pulls back slightly, but then the bulls push back again to try to test this level. If the price turns down again from around this level, then we are likely to be witnessingDouble topThe appearance of form.
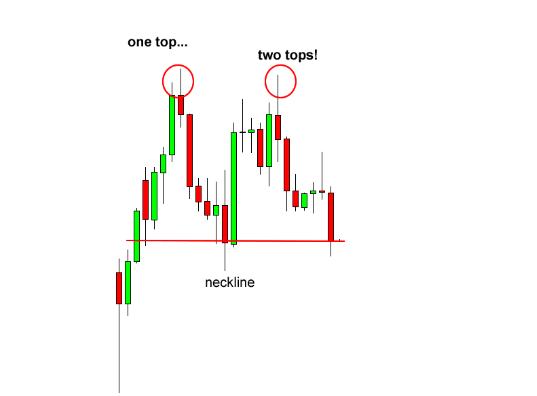
In the chart above, we can see that after a relatively strong rise in prices, two similar peaks were formedDouble top。
It is important to note that the second top is often difficult to effectively surpass the high of the first top. This is a strong reversal signal, indicating that the upward momentum may be coming to an end. inIEXSIn the foreign exchange learning system, this signal is seen as a sign of a weakening buyer's power.
withDouble topThe pattern is gradually confirmed, and we can consider setting our stop loss order below the neckline. This is because we anticipate that the previous uptrend may reverse.
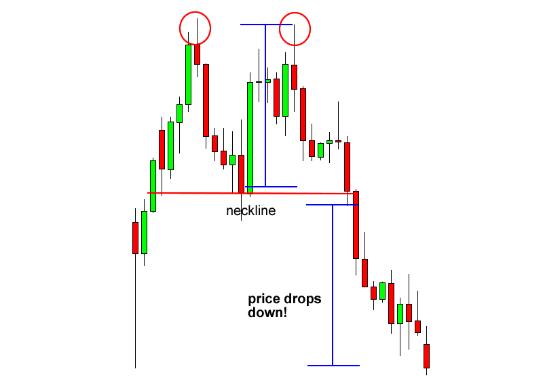
As you can see from the chart, the price finally fell below the neckline and went through a smooth downtrend. Remember,Double topIt belongs to a type of reversal pattern, so after a more obvious uptrend, we can consciously look for such patterns.
In addition, you may find that the price falls below the neckline, usually withDouble topThe height of the formation is roughly the same. Mastering this can help us make more reasonable judgments when setting profit targets.
double bottom

double bottomIt is also a trend reversal pattern, but as opposed to a double top, we think more about going long than short. This pattern occurs after two price declines, when two "bottoms" or troughs have been formed.
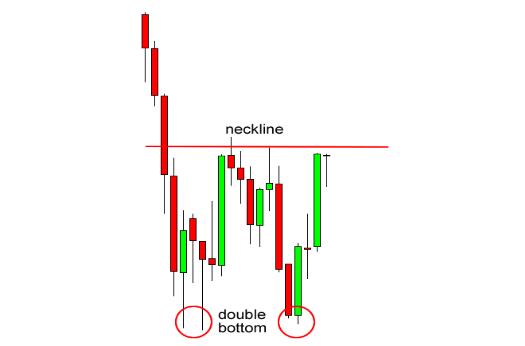
As can be seen from the chart above, after the previous decline, the price formed two troughs, as the price continued to fall but it was difficult to break through a key support level.
It is worth noting that the second bottom is often difficult to fall significantly below the low of the first bottom. This is a sign that the selling pressure may be coming to an end and a reversal may start at any time. In the practical application of IEXS foreign exchange, this signal is often used to capture the turning point of the market.
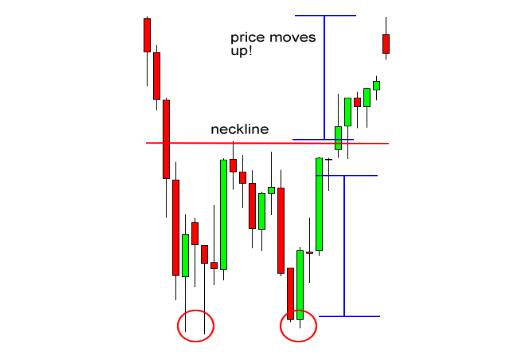
Did you see it?
The price then broke through the neckline and embarked on a beautiful upward trend.
Please note that the increase in prices is usually also related todouble bottomThe height of the shape roughly matches.
Remember, andDouble topSomething like that.double bottomThe pattern is also a trend reversal pattern. After a more obvious decline, we have a better chance of seeing this pattern emerge.
Please indicate the source: https://www.daoctech.com/fxoutrade/2376.html
Disclaimer: The content of this article does not represent the views of the Institute of Foreign Exchange. The content is for reference only and does not constitute investment advice. Investors operate accordingly at their own risk.