
The Four Functions of Bollinger Bands and Their Applications in Trading
Bollinger bands play an important role in technical analysis, and their unique construction ideas can play a great role in our analysis of exchange rate trends. Unlike other oscillating indicators, inforeign exchange marketThe usage of Bollinger Bands is rather unique. Let's learn how to use Bollinger Bands in foreign exchange trading.
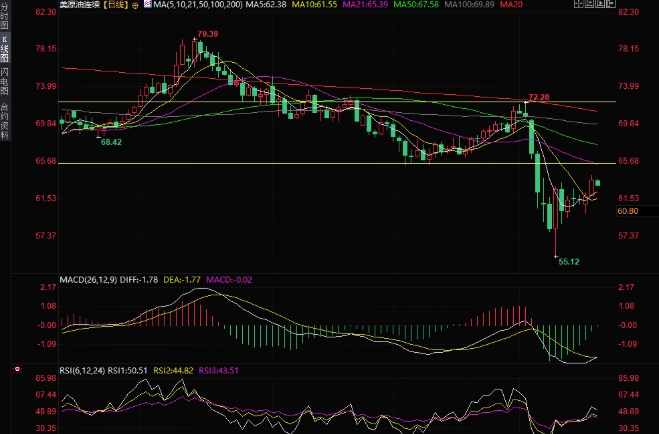
Bollinger Bands have four major functions:
1. Bollinger Bands can indicate support and pressure positions.
2. Bollinger Bands can display overbought and oversold;
3. Bollinger Bands can indicate trends.
4. Bollinger Bands have the function of a channel.
Bollinger Bands are very effective and convenient to use because they have a variety of functions. Once mastered, the signal is clear and the use is flexible. They are loved by professional investors and are also one of the most commonly used technical indicators on international financial marekts.
In the normal range, Bollinger Bands use techniques and methods such as:
The normal range is usually that the stock price runs within a certain width of the band range. Its characteristic is that the stock price does not rise or fall extremely sharply, and is in a relatively balanced state. At this time, the method of using Bollinger Bands is very simple.
1. When the price crosses the upper limit pressure line (dynamic upper limit pressure line, static upper pressure line BOLB1), the selling point signal;
2. When the price crosses the lower support line (dynamic lower support line, static bottom support line BOLB4), buy point signal;
3. When the price crosses the middle line from bottom to top (static crosses BOLB3 from BOLB4), it is the signal up the ante;
4. When the stock price crosses the midline from top to bottom (statically crossing BOLB2 from BOLB1), it is a sell signal.
How to use Bollinger Bands in unilateral rising quotes:
In a strong market, the stock price continues to rise, usually running between BOLB1 and BOLB2. When the stock price continues to rise for a long time, the stock price passes through BOLB1 the next day and further breaks BOLB2, causing the BOLB1 curve to appear from rising to flattening. This is a sell signal.
The significance of Bollinger Bands indentation:
1. After several waves of decline, it often turns to a longer period of narrow finishing. At this time, we find that the upper and lower limits of Bollinger Bands are extremely small, getting narrower and narrower, and getting closer. The difference between the highest and lowest prices shown in the intraday is extremely small, and there is no profit space in the short term. Often, even the handling fee cannot be earned. During the day, the trading is not active, and the trading volume is scarce. Investors should pay close attention to this narrowing situation, because a wave of market may be brewing. Once the trading volume increases, the stock price rises, the Bollinger Bands open wider, and the rising market begins.
2. If the Bollinger Band is extremely narrow at a high level, once the stock price breaks down, the Bollinger Band opening expands, and a round of decline will be inevitable.
Please indicate the source: https://www.daoctech.com/fxschool/1588.html
Disclaimer: The content of this article does not represent the views of the Institute of Foreign Exchange. The content is for reference only and does not constitute investment advice. Investors operate accordingly at their own risk.