
Popular Science of Indicators: Precautions for the Practical Application of RSI Indicators
The RSI Relative Strength Index, created by WellsWider, uses price movements over a specific period of time to predict the future direction of price movements. In fact, the RSI calculates the ratio of price increases to decreases over a certain period of time, measures the internal strength of the price, and selects strong trading targets according to the principle of selecting the strong and eliminating the weak.
However, in the process of using the indicator, foreign exchange traders often get confused. Sometimes the indicator is seriously overbought, but the exchange rate continues to rise. Sometimes the indicator is blunt in the oversold area for more than ten weeks, and the exchange rate has not stopped falling and stabilized. The relationship between the indicator and the exchange rate is confused here. The indicator cannot determine the rise and fall of the exchange rate, but the exchange rate determines the operation of the indicator. The exchange rate is the cause, the indicator is the effect, and the effect can be deduced from the cause. The cause is reversed, and it may not make sense. So, what is the true meaning of the indicator when it is used in actual combat? The author believes that the trend is supreme, the trend is followed, and the market is yielded.
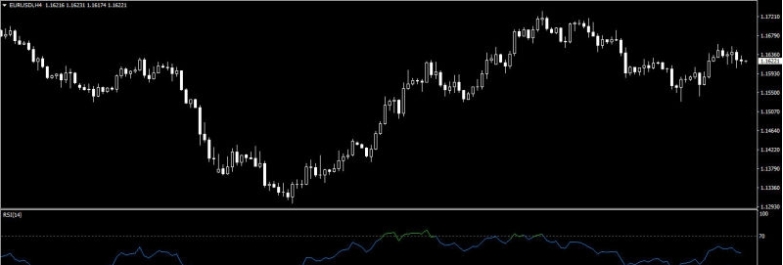
Before the rising and falling trend has not changed, do not try to use the overbought, oversold, passivation, etc. of the indicator to blindly determine the rebound or correction, but yield to the market and the trend. The trend has no way to win the indicator. Of course, this is not to completely abandon the indicator, on the contrary, it is to make full use of its auxiliary reference function. When the exchange rate trend continues to rise or fall, the indicator will continue to be overbought or oversold, and when the exchange rate turns, the indicator will then turn the trend buying and selling signal, thus providing a strong technical reference for the operation. This is the true meaning of the use of indicators.
RSI indicator on MT4 & MT5 software
When using the RSI indicator in actual combat, the following points should be taken into account:
1. If the RSI is above 50, it is a strong market. If it is above 80, it will enter the overbought zone, which is easy to form a short-term correction. If it is below 50, it will enter the oversold zone, which is easy to form a short-term rebound. The RSI was originally below 50 and then reversed upward to break through the 50 boundary, which means that the exchange rate has strengthened; the RSI was originally above 50 and then reversed downward to fall below the 50 boundary, which means that the exchange rate has weakened. However, there are often indicators that are overbought but not falling, oversold but not rising. The RSI value has little effect on judgment.
2. There are generally two long-term and short-term RSI crosses. Short-term RSI is larger than long-term RSI, which is a long market, and vice versa. Short-term RSI is a buy signal when it crosses long-term RSI from bottom to top in the oversold area below 20. Short-term RSI is a sell signal when it crosses long-term RSI from top to bottom in the overbought area above 80.
3. Morphological analysis is widely used in RSI, and can be used as a buying and selling signal based on the head and shoulders top or bottom, double head or bottom reversal patterns that appear in overbought or oversold areas.
4. When the deviant exchange rate is lower than the wave, and the opposite RSI is higher than the wave, it is the bottom deviation, and the exchange rate is easy to reverse and rise. When the exchange rate is higher than the wave, and the RSI is lower than the wave, it is the top deviation, and the exchange rate is easy to reverse and fall.
5. The trend line connects the two consecutive bottoms of the RSI, drawing a tangent line sloping from left to right. When the RSI falls below this tangent line, it is a good sell signal. When the RSI breaks through this tangent line, it is a good buy signal. In fact, this is just a short-term buy and sell signal, and the midline effect is not very good.
Please indicate the source: https://www.daoctech.com/fxschool/1593.html
Disclaimer: The content of this article does not represent the views of the Institute of Foreign Exchange. The content is for reference only and does not constitute investment advice. Investors operate accordingly at their own risk.