
Technical analysis: Bears regain control, seek to test key support levels
Gold prices fell for a third consecutive session on optimism over the strength of the dollar and signs of progress in trade talks between the US and Europe.
After two rebuffs of upward probes and a false breakout of the downtrend line, which connects the all-time high of $3,500 with the lower top of $3,452 on June 16, the bears regained control. A bearish swallowing pattern formed on the daily chart, releasing a new bearish signal.
The strong downward momentum has pushed gold prices down more than 2.5% in the past three days, giving up more than half of the recent gains in the $3246-3438 rally band (the Fibonacci 50% retracement is at $3,342, resonating with the 20-day moving average), and approaching the key support level of $3,330 (the top of the daily equilibrium cloud). Upward daily cloud bands have been supporting gold prices since mid-January, and the top of the cloud has withstood bears several times over the past two months.
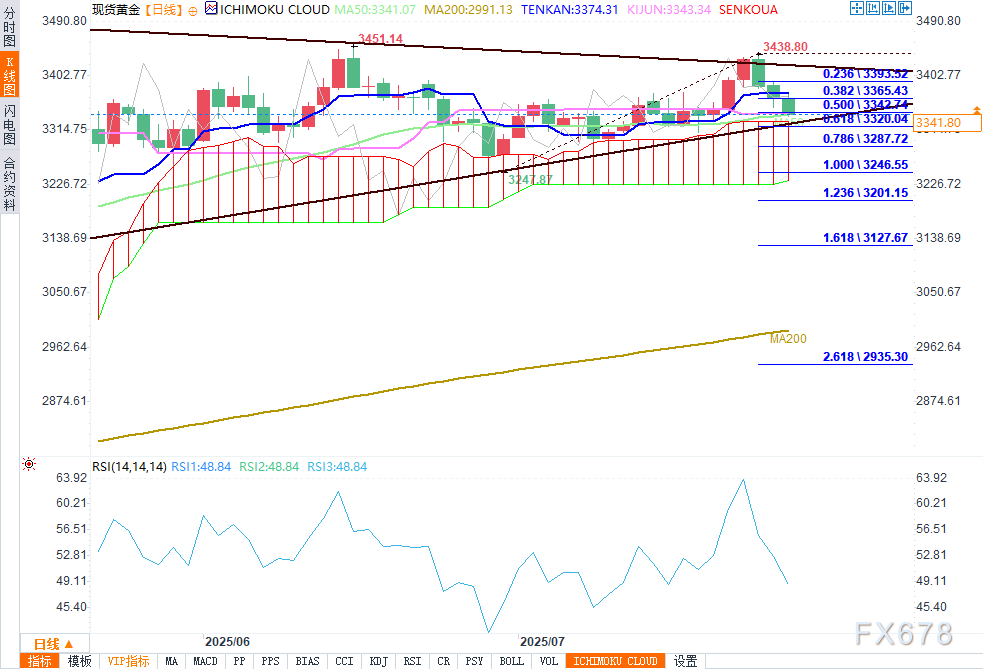
(Daily chart of spot gold, source: Internet)
If the price of gold falls below the daily cloud band and loses another key support near $3,320 (trendline support/Fibonacci 61.8% retracement), it will force a large number of bulls to leave the market and may further enter the $3,300- $3,290 range (psychological level/Fibonacci 76.4% retracement).
The weak technical indicators on the daily chart (the 14-day momentum indicator touched the central axis and tried to fall into negative territory; the price of gold fell below the 10-day and 20-day moving averages) confirm this bearish view, and the tombstone doji K-line pattern formed on the weekly chart also indicates that the current sellers are dominant.
However, it is necessary to focus on the reaction of gold prices at the top of the daily cloud, as the cloud band remains a very important support level and may once again limit the decline.
Resistance levels: $3,350; $3,365; $3,374; $3,393
Support levels: $3,330; $3,320; $3,309; $3,300
Please indicate the source: https://www.daoctech.com/fxschool/2043.html
Disclaimer: The content of this article does not represent the views of the Institute of Foreign Exchange. The content is for reference only and does not constitute investment advice. Investors operate accordingly at their own risk.