
The eye of the US debt storm is forming? The "judgment day" of US dollar gold is coming!
On Thursday (September 18), Beijing time, the global financial marekt showed a volatile pattern under the dual influence of the latest policy signal of the Federal Reserve and the liquidity demand at the end of the quarter. The US dollar index fluctuated in a narrow range of 96.40-97, reflecting the market's trade-off between the Federal Reserve's interest rate cut expectations and risk aversion. Spot gold ran in the 3644-3704 range, showing the game between safe-haven demand and real interest rate expectations. In the US Treasury market, the overnight repo rate (GC) opened at 4.18%, down 24 basis points from the previous day, reflecting the market adjustment after the Federal Reserve cut interest rates by 25 basis points in September.
This article will start fromTreasury marketFrom a dynamic perspective, we analyze the short-term trends of the US dollar and gold, and combine fundamental and technical aspects to predict future trends.
Treasury marketThe core impact of liquidity and interest rate cut expectations
Treasury marketAs the transmission hub of the trend of the dollar and gold, its dynamics have a profound impact on both. On September 18, the Federal Reserve confirmed a further 25-50 basis point cut in interest rates during the year, and the target range for the federal funds rate was adjusted to 4.25% -4.5% or 4.0% -4.25%. Market expectations (CME FedWatch tool shows) that the FOMC meeting in November and December may cut interest rates by another 50-75 basis points, and the final interest rate may fall to 3.75% -4.0%. At the same time, the Federal Reserve maintains the pace of quantitative tightening (QT), reducing the US dollar 60 billion US debt and 35 billion US dollar MBS every month. This policy is not good forTreasury marketLiquidity poses a constant pressure.
Short-term Treasury bonds and liquidity fluctuations
The end of the quarter (September 30) is approaching, and the market liquidity demand is rising. The use of the Federal Reserve's Permanent Repo Facility (SRF) is expected to surge to $300- 50 billion in response to pressure from bank regulatory reports, tax payments, etc. The balance of the overnight reverse repurchase facility (ON RRP) may increase from the current $1000- 110 billion to $1200- 150 billion, reflecting the "parking" demand of institutions in a volatile market. Yields on short-term US Treasuries (such as the 3-month T-bill) could rise from 4.5% to 4.7% -4.8% as institutions increase their holdings of US Treasuries as collateral. From a technical perspective, the 2-year and 5-year Treasury yields (currently 4.18% and 4.08%) may briefly rise under the pressure of the repo market, but the Federal Reserve's SRF operation will limit yields from climbing too rapidly.
Long-term Treasury bonds and macro expectations
Long-term US Treasury bonds (e.g. 10-year, yields around 3.7% -4.0%) are more driven by expectations of interest rate cuts and inflation data. If the FOMC signals a slowdown in QT at its October or December meeting (e.g. reducing the size of the US Treasury balance sheet shrinkage of $60 billion per month), the 10-year yield may decline to 3.5% -3.8%, as the market expects the supply pressure of US Treasuries to ease. The current core PCE inflation rate (2.5% -2.7%) is close to the 2% target, and expectations of a soft economic landing have strengthened, providing room for interest rate cuts and potential QT adjustments. However, if inflation data exceed expectations or geopolitical risks (such as the situation in Russia and Ukraine) intensify, risk aversion may push up long-term US Treasury demand and depress yields.
Market sentiment and transmission mechanisms
Treasury marketThe central role of this is its dual transmission of US dollar financing costs and safe-haven demand. Tighter liquidity at the end of the quarter may push up SOFR (current 10-day average of 4.41%), indirectly supporting US dollar demand; while the expectation of interest rate cuts weakens the attractiveness of US dollar assets and pushes up the safe-haven value of gold. Traders need to pay close attention to the September 30 New York Fed SRF/ON RRP data and the early October FOMC meeting notes to capture the further impact of policy signals on US Treasury yields.
Dollar index: waiting for a breakthrough in the direction of volatility
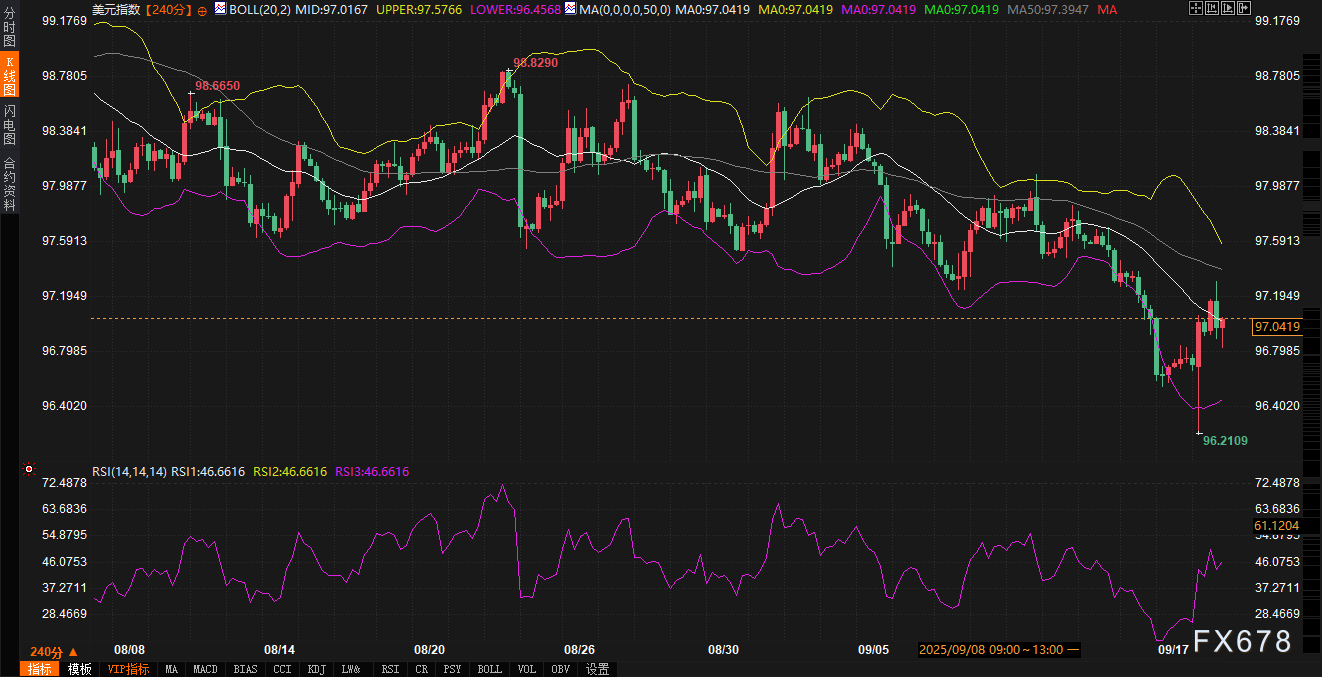
The US Dollar Index (DXY) is currently trading at 97.0360, near the middle Bollinger Band (97.0163), with a slight increase of 0.03% during the day. The technical surface shows that the US dollar has formed an oscillating box in the 96.40-97 range, the Bollinger Band bandwidth has narrowed to 1.12 points, and the RSI indicator 46.81 is in the neutral weak area, indicating that the long and short forces are temporarily balanced. The moving average system is in a bearish arrangement (MA10 > MA50), but the short-term moving average (MA06/08/09 about 97.0419) coincides with the current price, indicating a lack of momentum, and a directional breakthrough needs fundamental catalysis.
Fundamental Driven
The path of the Federal Reserve's interest rate cut is the core variable of the trend of the US dollar. The 25 basis points cut in September has been partially digested, and the market expects another 25-50 basis points drop in November or December. If the pace of interest rate cuts is in line with expectations (cumulative 50-75 basis points), the US dollar index may fall to the 98-100 range; if it exceeds expectations (such as more than 75 basis points), it may fall below 98 and test the second support level of 95.80. Quarter-end liquidity tightening (such as a surge in SRF usage) may temporarily push up the cost of US dollar financing, supporting DXY to test 102-103 at the end of September. However, synchronized easing by global central banks (such as the euro area, Japan) may maintain the relative attractiveness of the US dollar and limit its downside.
technical analysis
The US dollar index has been repeatedly tested in the 96.40-97 range since March, with key resistance 97.60 (Bollinger upper rail) and support 96.40 (Bollinger lower rail + previous low) forming a volatile framework. The breakout needs to be accompanied by the RSI standing above 50 or the Bollinger Band opening, and the current volatility contraction indicates that a directional breakout is approaching. Traders need to pay attention to the linkage of the US dollar against the euro and the pound during the European trading session, as well as the market reaction of economic data (such as non-agricultural and CPI) during the New York session. Some traders pointed out that if the US dollar fails to break through 97.60, the short-term volatility may continue, and the risk of false breakouts is high.
The linkage between the US dollar and US debt
The volatility of US Treasury yields directly affects the trend of the dollar. The rise in short-term Treasury yields may strengthen demand for the dollar, especially when liquidity is tight at the end of the quarter; the decline in long-term Treasury yields (if QT slows) may reduce the attractiveness of the dollar. Traders need to be wary of the interaction between interest rate cut expectations and risk aversion, such as tariff rhetoric or the heating up of the situation in Russia and Ukraine, which may push up safe-haven demand and temporarily support the dollar.
Spot gold: the game between risk aversion and bond market transmission
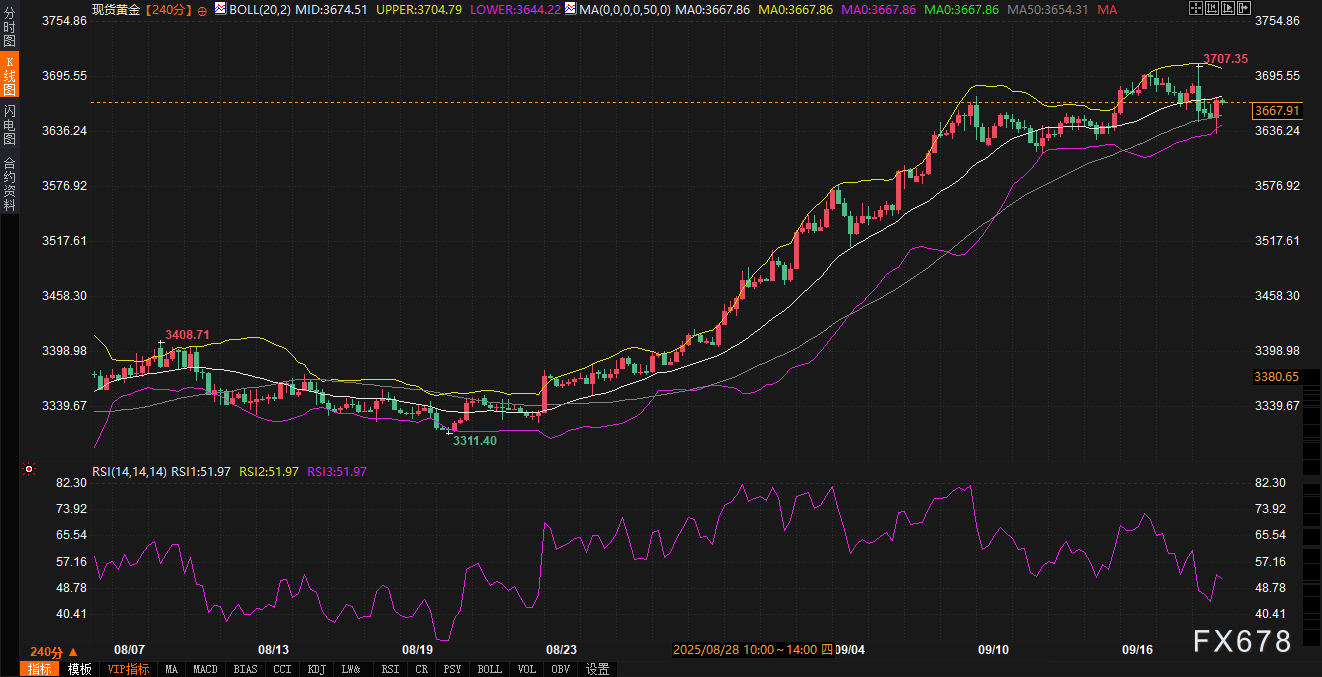
Spot gold was reported at $3667.59/oz, up 0.21% on the day. The price is close to the middle Bollinger Band rail (3674.50), but lower than the upper rail (3704.79). The 50-period moving average (3654.31) provides short-term support, and the RSI indicator 51.86 is in the neutral range, indicating a strong wait-and-see mood in the market. The technical structure shows the shape of "moving average bonding + Bollinger Band narrowing". The price fluctuates in the 3644-3704 range, and the bandwidth is about $60, indicating that a directional breakthrough is approaching.
Fundamental DrivenThe Risk Avoidance Effect of Bond Market Transmission
The price of gold is driven by both expectations of real interest rates and demand for safe havens. The Federal Reserve's interest rate cut reduces the real yield on US Treasury bonds (about 1.5% -1.8% real yield for 10 years), increasing the attractiveness of gold. If it falls by another 50-75 basis points during the year, the real yield may further decline to 1.2% -1.5%, supporting the upward trend of gold prices.Treasury marketLiquidity fluctuations (such as an increase in SRF usage at the end of the quarter) may push up short-end yields, indirectly strengthening the dollar and suppressing gold. However, risk aversion triggered by geopolitical risks (such as the situation in Russia and Ukraine) or tariff remarks may push gold to break through the 3700 resistance and test the high before 3720. Analysts at well-known institutions pointed out that the recent slight increase in gold ETF holdings reflects the inflow of safe-haven funds, but the increase is limited, and follow-up data should be paid attention to.
technical analysis
Gold is currently oscillating in the 3644-3704 range, with key support 3650 (50 moving average + psychological level) and resistance 3700 (integer level + Bollinger upper rail) forming a trading framework. If you stand firm at 3670 (the area where the middle rail and the 50 moving average coincide), you may test 3700; if you fall below 3650, you may return to 3644 (Bollinger lower rail). A breakout requires the RSI to break out of the 50-60 neutral zone, accompanied by the strengthening of the negative correlation of the US dollar index. Traders need to pay attention to the sensitivity of gold prices to US dollar fluctuations during the New York session, as well as the dynamic changes in the US Treasury yield curve.
The linkage between gold and U.S. debt
Treasury marketThe transmission to gold is mainly through real yields and risk aversion. The decline in long-term US Treasury yields (if QT slows down) will reduce the opportunity cost of holding gold, supporting gold prices; the rise in short-term US Treasury yields may strengthen the US dollar and temporarily suppress gold. Geopolitical risks or market fluctuations (such as tight liquidity at the end of the quarter) may amplify gold's safe-haven properties, and traders need to pay close attention to the linkage between SPDR gold ETF holdings and US Treasury yields.
Outlook on future trends
Dollar index
In the medium and long term, the expectation that the Federal Reserve will further cut interest rates by 25-50 basis points this year (the FOMC meeting window in November and December) will continue to suppress the US dollar through the transmission of US bond yields. The current target range for federal funds is 4.0% -4.25% (adjusted after the interest rate cut in September). Market pricing (CME FedWatch tool) shows that interest rates may fall to 3.75% -4.0% by the end of 2025, with a cumulative interest rate reduction of 50-75 basis points. This will reduce the US dollar asset yield (such as the 10-year US Treasury bond from 3.7% -4.0% to 3.5% -3.8%), weaken the attractiveness of foreign capital inflows, and promote the overall pressure on DXY.
Spot gold
Gold runs in the short-term 3644-3704 range, and breaking through 3700 requires the cooperation of risk aversion or real yield decline. If geopolitical risks (such as the situation in Russia and Ukraine) or tariff remarks heat up, the price of gold may test 3720; if the US dollar strengthens due to liquidity demand, the price of gold may test 3644. Traders need to pay attention to the linkage between the US dollar index and US bond yields, as well as the reflection of changes in ETF positions on risk aversion demand.
Treasury market
Short-term Treasury yields may rise slightly (10-20 basis points) due to end-of-quarter liquidity pressure, while long-term Treasury yields may decline to 3.5% -3.8% due to interest rate cuts and QT rhythm. The yield curve may steepen in the short term, but the overall trend depends on FOMC policy guidance. Traders need to be wary of market overshoot reactions to Fed signals.
Overall, the trend of the dollar and gold is highly dependentTreasury marketLiquidity and yield changes. Traders should combine fundamentals (FOMC meetings, liquidity data) with technical (Bollinger Bands, RSI, etc.) to capture breakout signals, while paying attention to the potential catalytic effects of geopolitical risk and risk aversion.
Please indicate the source: https://www.daoctech.com/fxschool/2154.html
Disclaimer: The content of this article does not represent the views of the Institute of Foreign Exchange. The content is for reference only and does not constitute investment advice. Investors operate accordingly at their own risk.