
Introduction to Forex Candlestick Patterns: Analyzing Trading Signals with Your Head Up
spindle top
Candlesticks with longer upper shadows, longer lower shadows, and smaller solid parts are called candlesticksspindle topThe color of the solid part is usually not the focus
This pattern usually reflects indecision between buyers and sellers.

Smaller entities, both positive and negative, show little change in the closing price compared to the opening price. At the same time, the shadow part shows that the buyer and seller are fighting fiercely, but neither side has a clear advantage.
Although the closing price was not much different from the opening price, the price experienced significant fluctuations during the trading session. It was difficult for both buyers and sellers to fully control the situation, and eventually a state of equilibrium was formed.
IFspindle topThe pattern appears in an uptrend, which usually means that the power of buyers in the market may be weakening, and the direction of operation may change.
IFspindle topPatterns appear in a downtrend, which usually indicates that the strength of the sellers in the market is running out, and this is likely to indicate that the market is about to reverse.
bald head barefoot shape
Bare head and barefoot means that the candle line has no upper and lower shadows. Depending on the color of the solid part,bald head barefoot shapeIt can be divided into the following two types: white bald feet and black bald feet.
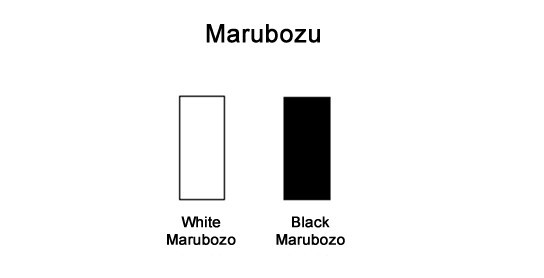
The white bald barefoot contains a long white solid section with no upper and lower shadows. The opening price is the lowest price of the day, and the closing price is the highest price of the day. This is a more bullish pattern because it shows that the buyer is in control of the market throughout the trading session. It is usually the beginning of a bull continuation pattern or a bullish reversal pattern.
The black bald barefoot contains a long black solid section with no upper and lower shadows. The opening price is the highest price of the day, and the closing price is the lowest price of the day. This is a more bearish pattern because it shows that the sellers are in control of the market throughout the trading session. It is usually the beginning of a bear market continuation pattern or a bearish reversal pattern.
Doji
DojiHave the same opening and closing prices, or their actual parts are very short.DojiThe form should be very thin, resembling a thin thread.
DojiPatterns refer to indecision in the market, or a close match between buyers and sellers. During the trading session, the price may break or fall below the opening price, but eventually close very close to the opening price.
Neither the buyer nor the seller can fully control the entire market, resulting in a draw.
DojiThere are four common forms: the long-footed cross, the dragonfly cross, the tombstone cross, and the one-word line.
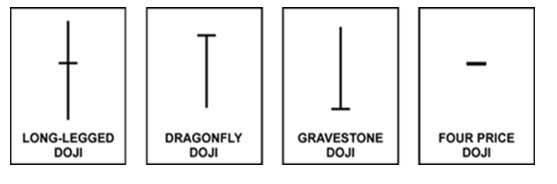
whenDojiWhen forming a pattern, special attention should be paid to the candlestick that follows.
IFDojiAppearing behind the Changyang line, this suggests that buyer power may be drying up. More buyers are needed to step in to push prices up further, but there may no longer be so many buyers in the market. At this point, sellers may be looking for short opportunities. This situation is similar to when buyers emerge after a wave of market gainsRaise one's headA wait-and-see situation.
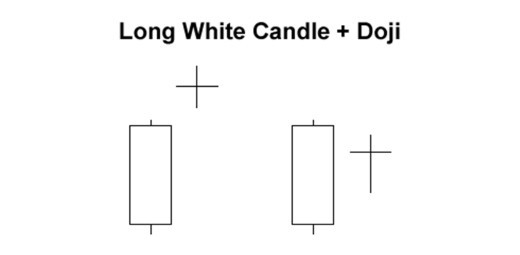
Tip: Changyang Line PlusDoji
IFDojiAppearing after the long negative line, this shows that the power of the seller is exhausted. More sellers need to intervene in order to lower the price further, but the strength of the sellers in the market is insufficient, and they cannot continue to push the price down. At this time, the buyer may enter the market with his head held high at the low level, and a new round of upward movement may be about to begin.
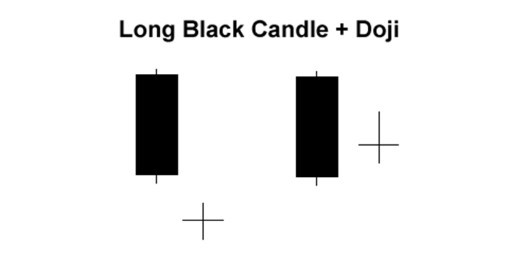
Tip: Long negative line plusDoji
Although the price decline has stopped due to the lack of new selling, further buying is required to confirm the establishment of the reversal. We can judge the trend change by waiting for the white candlestick to close above the opening price of the long negative candlestick.
In the next lesson, we will learn about specific candlestick patterns and their significance. Hopefully, through the candlestick chart series, you will learn how to recognize candlestick patterns and form sound trading strategies based on this knowledge.
Please indicate the source: https://www.daoctech.com/fxschool/2383.html
Disclaimer: The content of this article does not represent the views of the Institute of Foreign Exchange. The content is for reference only and does not constitute investment advice. Investors operate accordingly at their own risk.