
ATFX trading skills: using moving averages to analyze the market
In the analysis of the gold market, the moving average is an indispensable part, and it is also one of the tools commonly used by traders to judge the trend and price direction, which can help grasp the timing of entry and exit. Common parameters of moving averages include 5, 10, 30, 60, 120, and 240 days, reflecting the overall market trend and price information. For example, inatfxOn trading platforms, moving averages are widely used for market analysis.
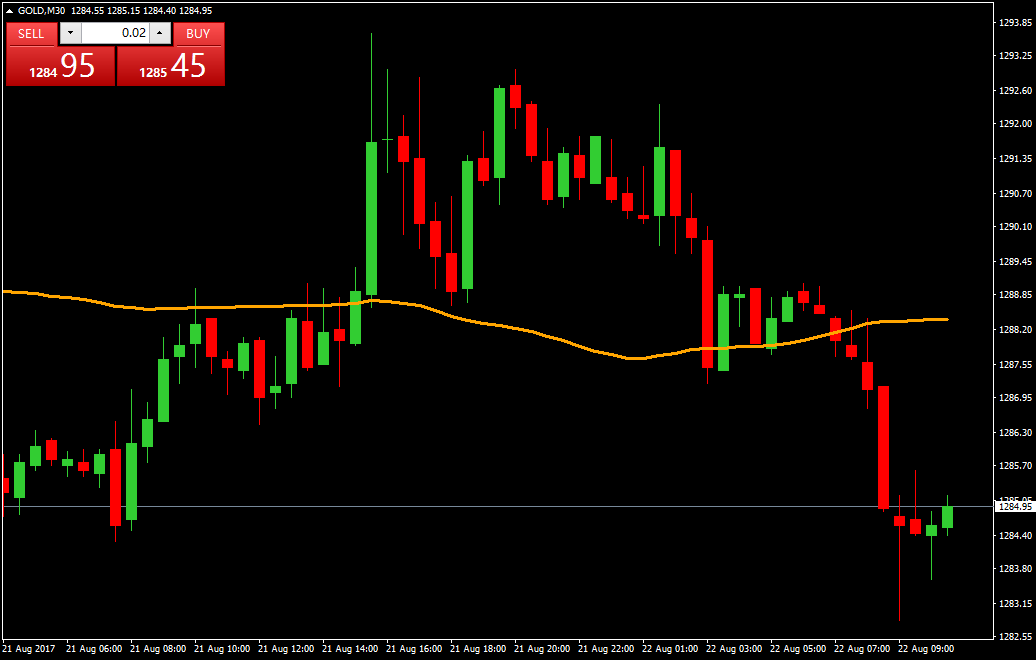
A moving average is essentially a trend-following tool that helps identify the end or reversal of a trend. It has a lag, doesn't get ahead of the market, just follows price changes faithfully, so it doesn't generate false signals.
Next, let's see how to use the daily moving average chart for gold market analysis.
Application in the rising trend of moving average
When the moving average shows a volatile upward pattern, and after a period of time, the moving average trend gradually flattens. At this time, if the price of gold falls from the upper direction and breaks the support of the moving average, you can consider leaving the market. In practice, you can compare multiple moving averages to reduce judgment errors. ATFX investors often analyze in combination with 5-day, 10-day, and 30-day moving averages.
The application of moving average downward trend
When the moving average is in a downward trend, the following three key points can be used to analyze the gold daily K-line:
1. Gold prices cross the moving average from below, breaking through its pressure level, but prices may still be under pressure at this time.
2. If the gold price fails to continue to rise after breaking through the moving average, but instead falls below the moving average, it is necessary to consider leaving the market.
3. This situation usually occurs in the rebound stage after a decline. If the price of gold continues to decline and weakens again after several rallies, it should be decisive.
Application of moving average in sideways finishing
When the moving average indicator shows a downward trend, the price of gold starts to move up and close to the moving average after oscillating below it for a period of time. However, when the price of gold approaches the moving average, it is resisted and falls back. At this time, you can consider leaving the market.
Please indicate the source: https://www.daoctech.com/fxschool/2541.html
Disclaimer: The content of this article does not represent the views of the Institute of Foreign Exchange. The content is for reference only and does not constitute investment advice. Investors operate accordingly at their own risk.