
Full analysis and application skills of common chart patterns
What is a chart pattern?
In the financial trading market, buyers and sellers are always playing a game of power, and the chart is a visual record of the outcome of this game. People gradually found some typical chart patterns on the chart, and with the help of them, they can clearly see whether the buyer is dominant or the seller is strong in the market. Moreover, with these classic patterns appearing again and again, people find that the market always presents the same law of changes in the power of buyers and sellers. Therefore, we can learn and accumulate pattern experience to predict subsequent trends, which is the core of pattern analysis. Through AnzoForex PlatformTraders can also easily observe and apply these classic patterns.
Typical chart patterns include two main types: reversal patterns and persistent patterns. In this article, we will introduce three of the most common chart patterns to gain a deeper understanding of how pattern analysis can predict price movements and how traders can use pattern analysis to make more informed trading decisions.
Head and Shoulder Top and Head and Shoulder Bottom
The head and shoulders pattern is one of the most valued patterns by traders and one of the most common reversals. It usually develops gradually in an uptrend and signals that the market is about to reverse. That is, the appearance of the head and shoulders pattern often means the end of an uptrend.
A typical head and shoulders pattern is depicted in the following figure:
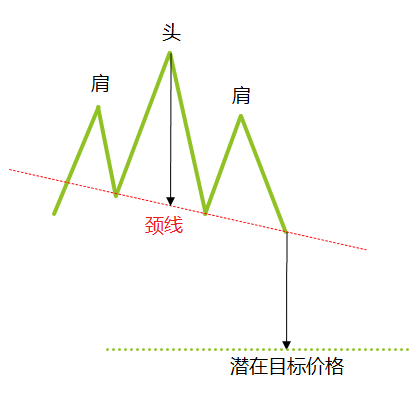
When the price rises and falls back to a fixed level, a peak is formed that looks like a left shoulder. The price then rises again and creates a higher peak than the previous peak, falling back to the support level of the first peak, the new peak is called the head, and the support level is called thenecklineIf the pattern is fully formed, the price will benecklineThe position rebounds and creates a lower peak, which is the right shoulder.
When you spot a head and shoulders pattern on a chart, a potential entry point is when the price confirms a breaknecklineWhen, that is, when the candle closes atnecklineBelow, we open a sell position at the opening of the next candle.
More cautious traders may prefer to wait for the price to be retestedneckline(That is, the price hits the top again.)neckline), when the price breaks through upwardsnecklineWhen it fails, enter the market and sell again. Of course, there may be times when the price is breakingnecklineAfter that, it began to decline directly without looking back. Whether to choose a more cautious trading strategy depends on traders' further observation and judgment of the market.
After a trade is opened, the profit target is usually set from the head tonecklineThe point distance.
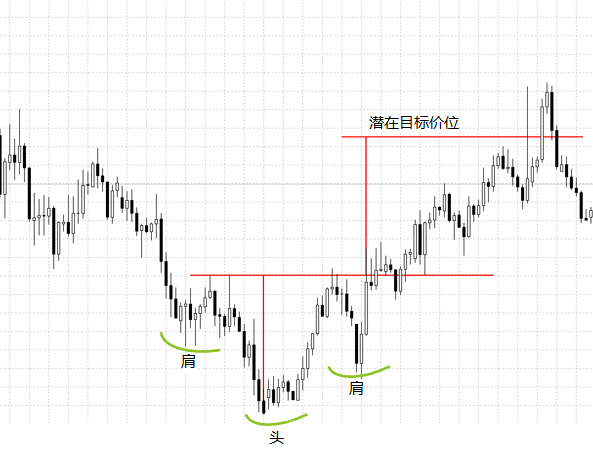
In addition, sometimes you may also encounter a head and shoulders bottom pattern, which tends to appear at the end of a downtrend and indicates a higher probability of future price increases. The head and shoulders bottom consists of a trough followed by a lower bottom and a higher trough. Similar to the head and shoulders top, the entry timing of the head and shoulders bottom is confirmednecklineWhen the price breaks through, or wait to seenecklineWhether it will be backtested. The following chart shows the shape of the bottom of the head and shoulders in the actual market:
Double top and double bottom
A double-top pattern often appears at the top of an uptrend. It is also a reversal pattern, indicating the end of an uptrend. A double-top pattern consists of two adjacent peaks with similar pricesnecklineLocated at the support level formed by the price. When the price falls below the support level, that isnecklineWe believe that the form has been established.
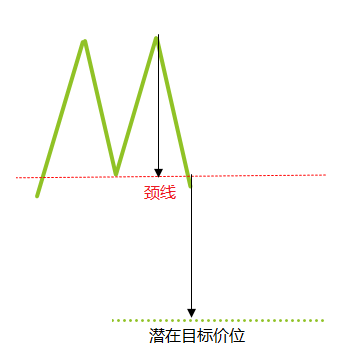
In terms of the choice of entry timing, it is generally possible to consider the price falling belownecklineOpen a sell position or wait for a price backtestnecklineFailure to enter the market and form a lower peak, once the backtest fails, often means that the price has stronger downward momentum.
Profit targets are set from the top tonecklineThe point distance.
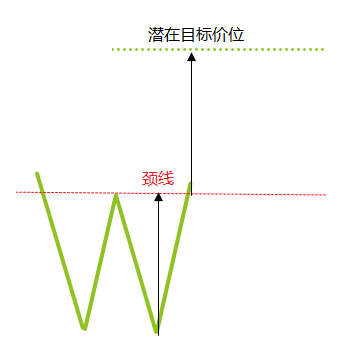
A double-top pattern, in turn, is a double-bottom pattern, which tends to appear at the end of a downtrend and consists of two adjacent troughs with similar prices. The appearance of a double-bottom pattern often means that an uptrend will follow. Likewise, we cannecklineEnter when you are broken through, or you can wait for the backtest.necklineEnter when you fail and form a higher bottom, backtestnecklineFailure implies a stronger upward price incentive.
flag
Unlike the head and shoulders pattern and the double top pattern introduced earlier, the flag pattern is a consolidation pattern that can occur in both an uptrend and a downtrend. Since the price cannot always be in a clear uptrend or a downtrend, it sometimes enters a consolidation phase. At this point you will find the price oscillating repeatedly before returning to the previous trend.
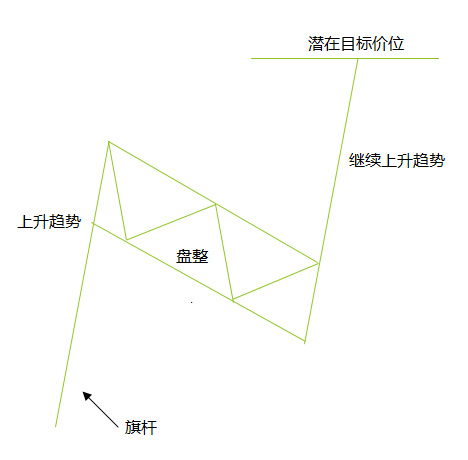
Above is the flag shape in an uptrend, with prices following an uptrend before consolidation. Draw parallel lines along the top and bottom of the consolidation trajectory to get a flag shape.
As an example of the flag trend above, when the price breaks the top flag line, you can consider entering the market to open a buy position. Or you can wait for the price to retest the flag line and create a higher trough before entering the market. This higher trough helps to improve the confidence of trading profits.
Calculate the number of points from the previous uptrend to the bottom flag and use it as the target profit point.
The chart below shows the flag pattern in the actual market uptrend. After the first uptrend is completed, the price continues to consolidate in the flag pattern, and eventually breaks through the top flag line to start the second uptrend.
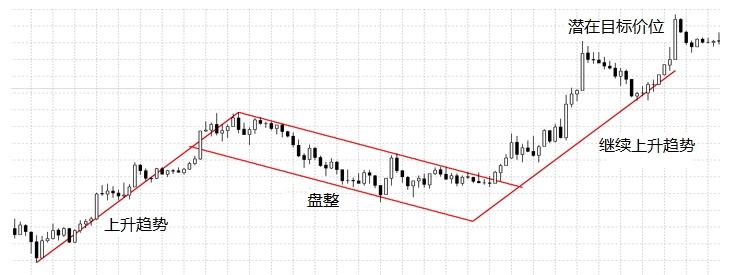
The above content can be used as an introductory guide for you to further learn pattern analysis. In the future, you will be exposed to more different types of chart patterns, so as to continuously improve your trading system. On professional platforms such as Anzo Forex, the application of these chart patterns will combine with real-time quotes to bring you more practical opportunities.
Please indicate the source: https://www.daoctech.com/fxschool/2314.html
Disclaimer: The content of this article does not represent the views of the Institute of Foreign Exchange. The content is for reference only and does not constitute investment advice. Investors operate accordingly at their own risk.